Details and Examples: PARETO Procedure
-
Details

-
Examples
Creating Before-and-After Pareto Charts Creating Two-Way Comparative Pareto Charts Highlighting the Vital Few Highlighting Combinations of Categories Highlighting Combinations of Cells Ordering Rows and Columns in a Comparative Pareto Chart Merging Columns in a Comparative Pareto Chart Creating Weighted Pareto Charts
Example 13.7 Merging Columns in a Comparative Pareto Chart
[See PARETO14 in the SAS/QC Sample Library]This example is a continuation of Example 13.4 and illustrates a method for merging the columns in a comparative Pareto chart.
Suppose that controls for metallization were introduced on Wednesday. To show the effect of the controls, the columns for Monday and Tuesday are to be merged into a column labeled Before Controls, and the remaining columns are to be merged into a column labeled After Controls. The following statements introduce a format named CNTLFMT that merges the levels of Day:
proc format;
   value cntlfmt   1-2 = 'Before Controls'
                   3-5 = 'After Controls';
The following statements create the chart shown in Output 13.7.1:
ods graphics on;
proc pareto data=Failure7;
   vbar Cause / class       = ( Process Day )
                freq        = Counts
                last        = 'Miscellaneous'
                scale       = count
                catleglabel = 'Failure Causes:'
                nohlabel
                nocurve
                nlegend;
   format Day cntlfmt.;
   label  Day = 'Status of Controls for Metallization';
run;
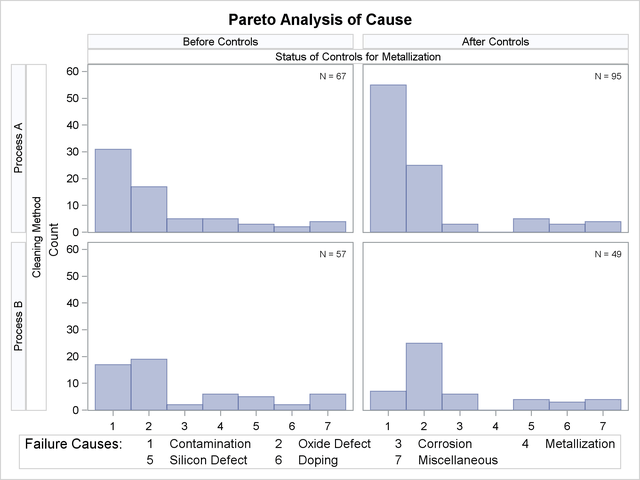
The levels of Day are determined by its formatted values, 'Before Controls' and 'After Controls'. By default, the order in which the columns are displayed is determined by the internal values. In this example, there are multiple distinct internal values for each level, and the procedure uses the internal value that occurs first in the input data set.