Example 10.1 Using Cross Validation to Select Number of Principal Components
This example uses cross validation to provide diagnostics for selecting the number of principal components to use in the model. It is an extension of the example in Getting Started: MVPMODEL Procedure.
proc mvpmodel data=flightDelays cv=one plots=(scree cvplot);
   var AA CO DL F9 FL NW UA US WN;
run;
The CV= option specifies the method of cross validation used to produce model diagnostics. The PLOTS= option produces only the combination scree plot and variance-explained plot in addition to the cross validation PRESS and  plots.
Selecting the number of principal components is a difficult process because there are many error functions to optimize, such as a function of PRESS or or Wold’s ratio, or an information criterion such as AIC or BIC. Output 10.1.1 shows the model information.
| Data Set | WORK.FLIGHTDELAYS |
|---|---|
| Number of Variables | 9 |
| Missing Value Handling | Exclude |
| Number of Observations Read | 96 |
| Number of Observations Used | 96 |
| Maximum Number of Principal Components | 9 |
| Validation Method | Leave-one-out Cross Validation |
When the CV= option is specified, more model information is produced than when the number of components is specified, as was seen in the section Getting Started: MVPMODEL Procedure.
The root mean PRESS values and Wold’s ratios are shown in Output 10.1.2.
| Cross Validation for the Number of Components |
||
|---|---|---|
| Number of Components |
Root Mean PRESS | Wold's Ratio |
| 0 | 1.010526 | . |
| 1 | 0.633557 | 0.401395 |
| 2 | 0.551645 | 0.801801 |
| 3 | 0.494667 | 0.903078 |
| 4 | 0.407067 | 0.843568 |
| 5 | 0.349972 | 0.920819 |
| 6 | 0.309677 | 1.039787 |
| 7 | 0.234439 | 0.882039 |
| 8 | 0.144627 | 0.598559 |
| 9 | 9.28E-15 | 6.25E-27 |
In this case, Wold’s ratio recommends a model with five components, as shown in Output 10.1.3.
| Number of Components Suggested by Wold's ratio | 5 |
|---|
There are other methods of choosing the number of principal components; see Chapter 69, The PLS Procedure (SAS/STAT User's Guide), for a discussion.
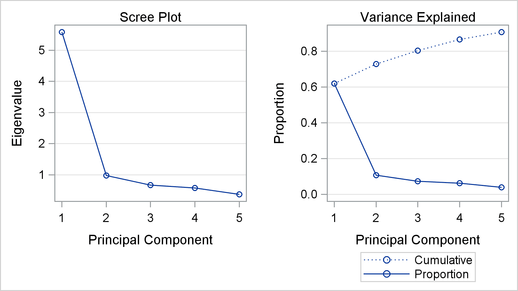
You can also use scree and variance-explained plots to select the number of principal components, as shown in Output 10.1.4 and root mean PRESS and plots as shown in Output 10.1.5.
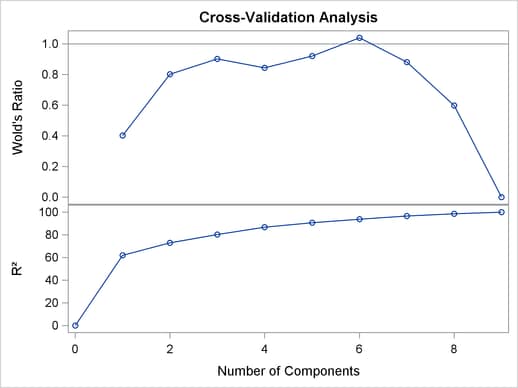
The cross validation plot is produced only when both the CV= option and the PLOTS=ALL or PLOTS=CVPLOT option are used.
Note: This procedure is experimental.