XCHART Statement: ANOM Procedure

Constructing ANOM Charts for Two-Way Layouts
This section provides the computational details for constructing an ANOM chart for the  th factor in an experiment involving two factors ( = 1 or 2). It is assumed that there is no interaction effect. See Example 4.5 for an illustration.
The following notation is used in this section:
|
|
|
number of groups (levels) for the |
|
number of replicates in cell |
|
total sample size |
|
variance of a response |
|
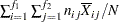
average response in cell |
|
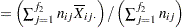
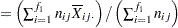
average response for |
|
average response for |
|
|
|
sample variance of the responses for the |
|
mean square error (MSE) in the two-way analysis of variance |
|
degrees of freedom associated with the mean square error in the two-way analysis of variance |
|
significance level |
|
critical value for analysis of means in a one-way layout for |

 th response at the
  th level of factor 1 and the
  th level of factor 2, where


 groups (treatment levels) when the sample sizes for each level are constant
  and
and Plotted Points
The points on the ANOM chart for factor 1 represent  ,
,  and the points on the ANOM chart for factor 2 represent
  ,
,  .
.
Central Line
The central line on the ANOM chart for the th factor is the overall weighted average  . Some authors use the notation
  for this average.
Decision Limits
It is assumed that
 |
where the quantities  are independent and at least approximately normally distributed with
 |
The correct decision limits for a given factor in a two-way layout are not computed by default when the th factor is specified as the group-variable in the XCHART statement, since the mean square error and degrees of freedom are not adjusted for the two-way structure of the data. Consequently,  and
and  must be precomputed and provided to the ANOM procedure, as illustrated in Example 4.5.
In the case of a two-way layout with equal group sizes ( ), the appropriate decision limits are:
 |
 |
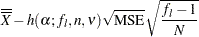 |
|||
 |
|
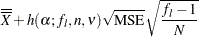 |
where the mean square error (MSE) is computed as in the ANOVA or GLM procedure:
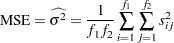 |
and the degrees of freedom for error is  . For details concerning the function
  , see Nelson (1982a, 1993).
You can provide the appropriate values of MSE and by
specifying
with the MSE= option or with the variable _MSE_ in a LIMITS= data set specifying
with the DFE= option or with the variable _DFE_ in a LIMITS= data set
In addition you can:
Specify
 with the ALPHA= option or with the variable _ALPHA_ in a LIMITS= data set. By default,
  .
. Specify a constant nominal sample size
for the decision limits in the balanced case with the LIMITN= option or with the variable _LIMITN_ in a LIMITS= data set. Specify
 with the LIMITK= option or with the variable _LIMITK_ in a LIMITS= data set.
 Specify
with the MEAN= option or with the variable _MEAN_ in a LIMITS= data set.