XCHART Statement: ANOM Procedure

Creating ANOM Charts for Means from Response Values
[See ANMX1 in the SAS/QC Sample Library]A manufacturing engineer carries out a study to determine the source of excessive variation in the positioning of labels on shampoo bottles. 1 A labeling machine removes bottles from the line, attaches the labels, and returns the bottles to the line. There are six positions on the machine, and the engineer suspects that one or more of the position heads might be faulty.
A sample of 60 bottles, 10 per position, is run through the machine. For each bottle, the deviation of the label is measured in millimeters, and the machine position is recorded. The following statements create a SAS data set named LabelDeviations, which contains the deviation measurements for the 60 bottles:
data LabelDeviations;
   input Position @;
   do i = 1 to 5;
      input Deviation @;
      output;
   end;
   drop i;
   datalines;
1  -0.0239  -0.0285  -0.0300  -0.0043  -0.0362
1  -0.0422  -0.0014  -0.0647   0.0094  -0.0016
2  -0.0201  -0.0273   0.0227  -0.0332   0.0366
2   0.0438   0.0556   0.0098   0.0564   0.0182
3  -0.0073   0.0285  -0.0440  -0.0221  -0.0139
3   0.0486   0.0357   0.0235   0.0134  -0.0020
4   0.0669   0.1073   0.0597   0.0609   0.0755
4   0.0362   0.0561   0.0899   0.0418   0.0530
5   0.0368   0.0036   0.0374   0.0116  -0.0074
5   0.0250  -0.0080   0.0302  -0.0015  -0.0464
6   0.0049  -0.0384  -0.0204  -0.0049  -0.0120
6   0.0071  -0.0308   0.0017  -0.0285  -0.0070
;
A partial listing of LabelDeviations is shown in Figure 4.21.
| The Data Set LabelDeviations |
| Position | Deviation |
|---|---|
| 1 | -0.0239 |
| 1 | -0.0285 |
| 1 | -0.0300 |
| 1 | -0.0043 |
| 1 | -0.0362 |
| 1 | -0.0422 |
| 1 | -0.0014 |
| 1 | -0.0647 |
| 1 | 0.0094 |
| 1 | -0.0016 |
| 2 | -0.0201 |
| 2 | -0.0273 |
| 2 | 0.0227 |
| 2 | -0.0332 |
| 2 | 0.0366 |
| 2 | 0.0438 |
| 2 | 0.0556 |
| 2 | 0.0098 |
| 2 | 0.0564 |
| 2 | 0.0182 |
The data set LabelDeviations is said to be in "strung-out" form, since each observation contains the position and the deviation measurement for a single bottle. The first 10 observations contain the measurements for the first position, the second 10 observations contain the measurements for the second position, and so on. Because the variable Position classifies the observations into groups (treatment levels), it is referred to as the group-variable. The input data set must be sorted by the group variable. The variable Deviation contains the deviation measurements and is referred to as the response variable (or response for short).
The following statements create the ANOM chart shown in Figure 4.22:
ods graphics off;
title 'Analysis of Label Deviations';
proc anom data=LabelDeviations;
   xchart Deviation*Position / alpha = 0.05;
   label Deviation = 'Mean Deviation from Center (mm)';
   label Position  = 'Labeler Position';
run;
This example illustrates the basic form of the XCHART statement. After the keyword XCHART, you specify the response to analyze (in this case, Deviation) followed by an asterisk and the group-variable (Position). Options are specified after the slash (/) in the XCHART statement. A complete list of options is presented in the section Syntax: XCHART Statement.
The input data set is specified with the DATA= option in the PROC ANOM statement when it contains raw measurements for the response.
Each point on the ANOM chart represents the average (mean) of the response measurements for a particular sample.
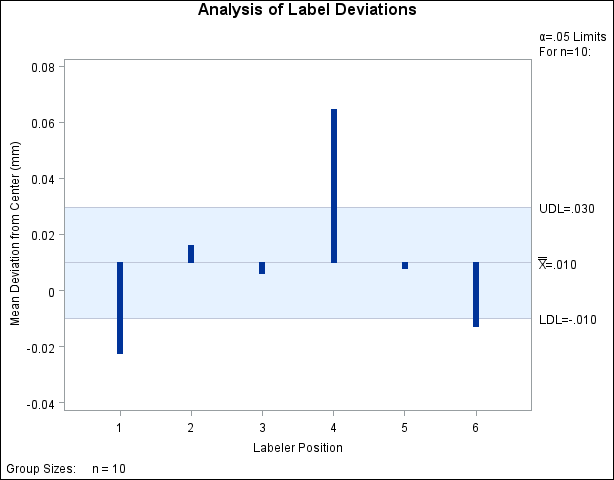
The average for Position 1 is below the lower decision limit (LDL), and the average for Position 6 is slightly below the lower decision limit. The average for Position 4 exceeds the upper decision limit (UDL). The conclusion is that Positions 1, 4, and 6 are operating differently.
By default, the decision limits shown correspond to a significance level of  ; the formulas for the limits are given in the section Decision Limits. You can also read decision limits from an input data set.
For computational details, see Constructing ANOM Charts for Means. For details on reading raw measurements, see DATA= Data Set.