PLOT Procedure
- Syntax

- Overview
- Concepts
- Results
- Examples Specifying a Plotting SymbolControlling the Horizontal Axis and Adding a Reference LineOverlaying Two PlotsProducing Multiple Plots per PagePlotting Data on a Logarithmic ScalePlotting Date Values on an AxisProducing a Contour PlotPlotting BY GroupsAdding Labels to a PlotExcluding Observations That Have Missing ValuesAdjusting Labels on a Plot with the PLACEMENT= OptionAdjusting Labeling on a Plot with a MacroChanging a Default Penalty
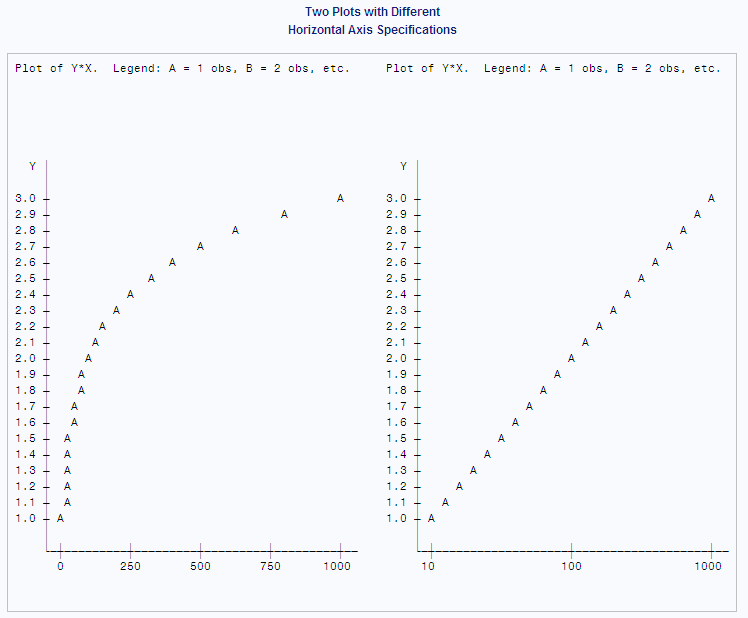
Example 5: Plotting Data on a Logarithmic Scale
| Features: |
PLOT statement option:: HAXIS= |
This example uses a
DATA step to generate data. The PROC PLOT step shows two plots of
the same data: one plot without a horizontal axis specification and
one plot with a logarithmic scale specified for the horizontal axis.
Program
data equa;
   do Y=1 to 3 by .1;
      X=10**y;
      output;
   end;
run;
proc plot data=equa hpercent=50;
    plot y*x / vspace=1;
    plot y*x / haxis=10 100 1000 vspace=1;
    title 'Two Plots with Different';
    title2 'Horizontal Axis Specifications';
run;
Program Description
Specify the plot sizes. HPERCENT=
makes room for two plots side-by-side by specifying that 50% of the
horizontal space is used for each plot.