PLOT Procedure
- Syntax

- Overview
- Concepts
- Results
- Examples Specifying a Plotting SymbolControlling the Horizontal Axis and Adding a Reference LineOverlaying Two PlotsProducing Multiple Plots per PagePlotting Data on a Logarithmic ScalePlotting Date Values on an AxisProducing a Contour PlotPlotting BY GroupsAdding Labels to a PlotExcluding Observations That Have Missing ValuesAdjusting Labels on a Plot with the PLACEMENT= OptionAdjusting Labeling on a Plot with a MacroChanging a Default Penalty
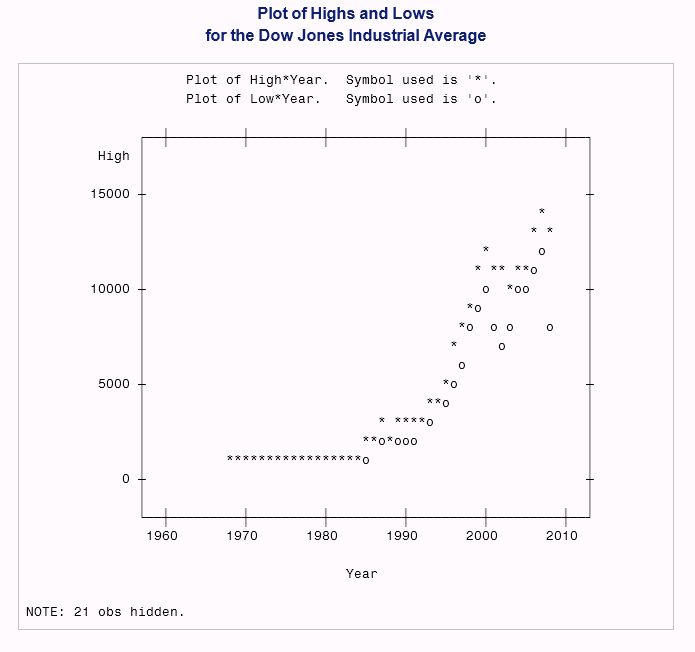
Example 3: Overlaying Two Plots
| Features: |
|
| Data set: | DJIA |
Program
options formchar="|----|+|---+=|-/\<>*";
data djia;
      input Year HighDate date7. High LowDate date7. Low;
      format highdate lowdate date7.;
      datalines;
1968 03DEC68   985.21 21MAR68   825.13
1969 14MAY69   968.85 17DEC69   769.93
...more data lines...
2006 27DEC06 12510.57 20JAN06 10667.39
2007 09OCT07 14164.53 05MAR07 12050.41
2008 02MAY08 13058.20 10OCT08  8451.19
;
proc plot data=djia;
   plot high*year='*'
        low*year='o' / overlay box
        haxis=by 10
        vaxis=by 5000;
   title 'Plot of Highs and Lows';
   title2 'for the Dow Jones Industrial Average';
run;
Program Description
Set the FORMCHAR option.Setting
FORMCHAR to this exact string renders better HTML output when it is
viewed outside of the SAS environment where SAS Monospace fonts are
not available.
Create the DJIA data set.
DJIA contains the high and low closing marks for the Dow Jones Industrial
Average from 1968 to 2008. The DATA step creates this data set.
data djia;
      input Year HighDate date7. High LowDate date7. Low;
      format highdate lowdate date7.;
      datalines;
1968 03DEC68   985.21 21MAR68   825.13
1969 14MAY69   968.85 17DEC69   769.93
...more data lines...
2006 27DEC06 12510.57 20JAN06 10667.39
2007 09OCT07 14164.53 05MAR07 12050.41
2008 02MAY08 13058.20 10OCT08  8451.19
;
Create the plot.The first
plot request plots High on the vertical axis, plots Year on the horizontal
axis, and specifies an asterisk as a plotting symbol. The second plot
request plots Low on the vertical axis, plots Year on the horizontal
axis, and specifies an 'o '
as a plotting symbol. OVERLAY superimposes the second plot onto the
first. BOX draws a box around the plot. OVERLAY and BOX apply to both
plot requests. HAXIS= specifies that the horizontal axis will show
the values 1968 to 2008 in ten-year increments. VAXIS= specifies that
the vertical axis will show the values in increments of 5,000.