PLOT Procedure
- Syntax

- Overview
- Concepts
- Results
- Examples Specifying a Plotting SymbolControlling the Horizontal Axis and Adding a Reference LineOverlaying Two PlotsProducing Multiple Plots per PagePlotting Data on a Logarithmic ScalePlotting Date Values on an AxisProducing a Contour PlotPlotting BY GroupsAdding Labels to a PlotExcluding Observations That Have Missing ValuesAdjusting Labels on a Plot with the PLACEMENT= OptionAdjusting Labeling on a Plot with a MacroChanging a Default Penalty
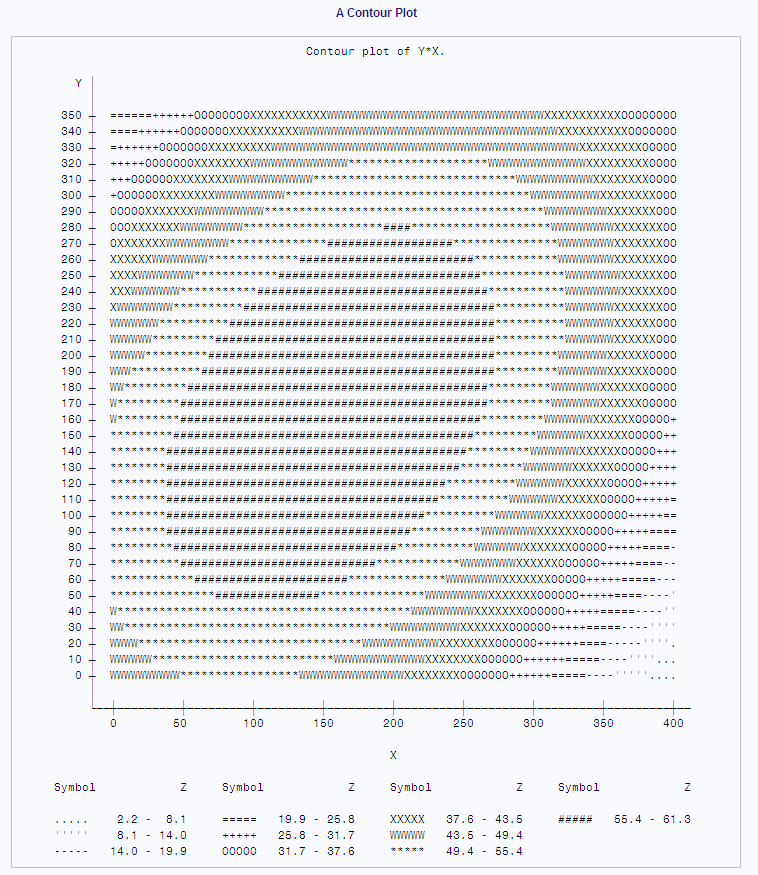
Example 7: Producing a Contour Plot
| Features: |
PLOT statement option:: CONTOUR= |
This example shows how
to represent the values of three variables with a two-dimensional
plot by setting one of the variables as the CONTOUR variable. The
variables X and Y appear on the axes, and Z is the contour variable.
Program statements are used to generate the observations for the plot,
and the following equation describes the contour surface: 
Program
options formchar="|----|+|---+=|-/\<>*";
data contours;
   format Z 5.1;
   do X=0 to 400 by 5;
      do Y=0 to 350 by 10;
         z=46.2+.09*x-.0005*x**2+.1*y-.0005*y**2+.0004*x*y;
         output;
      end;
   end;
run;
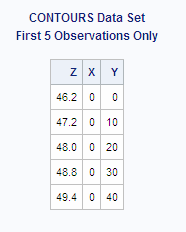
proc print data=contours(obs=5) noobs;
   title 'CONTOURS Data Set';
   title2 'First 5 Observations Only';
run;
                       CONTOURS Data Set                       1
                   First 5 Observations Only

                            Z    X     Y

                         46.2    0     0
                         47.2    0    10
                         48.0    0    20
                         48.8    0    30
                         49.4    0    40
options formchar="|----|+|---+=|-/\<>*";
proc plot data=contours;
plot y*x=z / contour=10;
    title 'A Contour Plot';
run;
Program Description
Set the FORMCHAR option.Setting
FORMCHAR to this exact string renders better HTML output when it is
viewed outside of the SAS environment where SAS Monospace fonts are
not available.
data contours;
   format Z 5.1;
   do X=0 to 400 by 5;
      do Y=0 to 350 by 10;
         z=46.2+.09*x-.0005*x**2+.1*y-.0005*y**2+.0004*x*y;
         output;
      end;
   end;
run;
Print the CONTOURS data set. The
OBS= data set option limits the printing to only the first 5 observations.
NOOBS suppresses printing of the observation numbers.
proc print data=contours(obs=5) noobs;
   title 'CONTOURS Data Set';
   title2 'First 5 Observations Only';
run;
CONTOURS data set.CONTOURS
contains observations with values of X that range from 0 to 400 by
5 and with values of Y that range from 0 to 350 by 10.
                       CONTOURS Data Set                       1
                   First 5 Observations Only

                            Z    X     Y

                         46.2    0     0
                         47.2    0    10
                         48.0    0    20
                         48.8    0    30
                         49.4    0    40
Set the FORMCHAR option.Setting
FORMCHAR to this exact string renders better HTML output when it is
viewed outside of the SAS environment where SAS Monospace fonts are
not available.