PLOT Procedure
- Syntax

- Overview
- Concepts
- Results
- Examples Specifying a Plotting SymbolControlling the Horizontal Axis and Adding a Reference LineOverlaying Two PlotsProducing Multiple Plots per PagePlotting Data on a Logarithmic ScalePlotting Date Values on an AxisProducing a Contour PlotPlotting BY GroupsAdding Labels to a PlotExcluding Observations That Have Missing ValuesAdjusting Labels on a Plot with the PLACEMENT= OptionAdjusting Labeling on a Plot with a MacroChanging a Default Penalty
Example 11: Adjusting Labels on a Plot with the PLACEMENT= Option
| Features: |
|
| Other features: |
RUN group processing |
| Data set: | CENSUS |
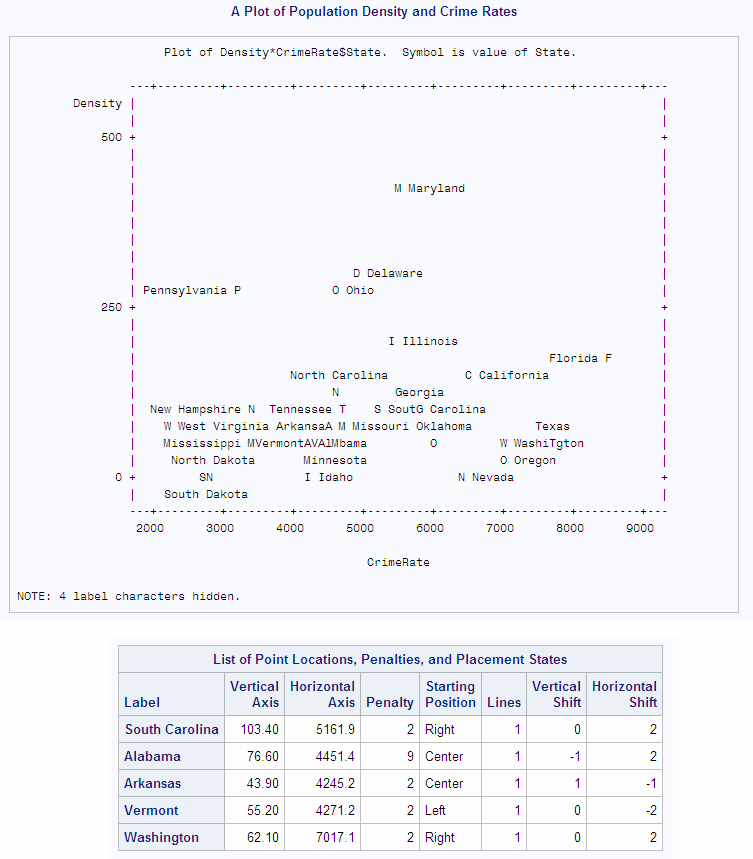
This example illustrates
the default placement of labels and how to adjust the placement of
labels on a crowded plot. The labels are values of variables in the
data set.(footnote1)
Program
options formchar="|----|+|---+=|-/\<>*";
data census;
   input Density CrimeRate State $ 14-27 PostalCode $ 29-30;
   datalines;
263.3 4575.3 Ohio           OH
62.1 7017.1  Washington     WA

...more data lines...

111.6 4665.6 Tennessee      TN
120.4 4649.9 North Carolina NC
;
proc plot data=census;
   plot density*crimerate=state $ state /
   box
   list=1
   haxis=by 1000
   vaxis=by 250
   vspace=10
   hspace=10;
    plot density*crimerate=state $ state /
              box
              list=1
              haxis=by 1000
              vaxis=by 250
              vspace=10
           placement=((v=2 1 : l=2 1)
                 ((l=2 2 1 : v=0 1 0) * (s=right left : h=2 -2))
                 (s=center right left * l=2 1 * v=0 1 -1 2 *
                  h=0 1 to 5 by alt));
   title 'A Plot of Population Density and Crime Rates';
run;
Program Description
Set the FORMCHAR option.Setting
FORMCHAR to this exact string renders better HTML output when it is
viewed outside of the SAS environment where SAS Monospace fonts are
not available.
Create the CENSUS data set. CENSUS
contains the variables CrimeRate and Density for selected states.
CrimeRate is the number of crimes per 100,000 people. Density is the
population density per square mile in the 1980 census. A DATA step, CENSUS, creates this data set.
data census;
   input Density CrimeRate State $ 14-27 PostalCode $ 29-30;
   datalines;
263.3 4575.3 Ohio           OH
62.1 7017.1  Washington     WA

...more data lines...

111.6 4665.6 Tennessee      TN
120.4 4649.9 North Carolina NC
;
Create the plot with a label for each data point.The plot request plots Density on the vertical axis,
CrimeRate on the horizontal axis, and uses the first letter of the
value of State as the plotting symbol. This makes it easier to match
the symbol with its label. The label variable specification (
$
                        state
) in the PLOT statement labels each point with the
corresponding state name.Specify plot options. BOX
draws a box around the plot. LIST= lists the labels that have penalties
greater than or equal to 1. HAXIS= and VAXIS= specify increments only.
PROC PLOT uses the data to determine the range for the axes.
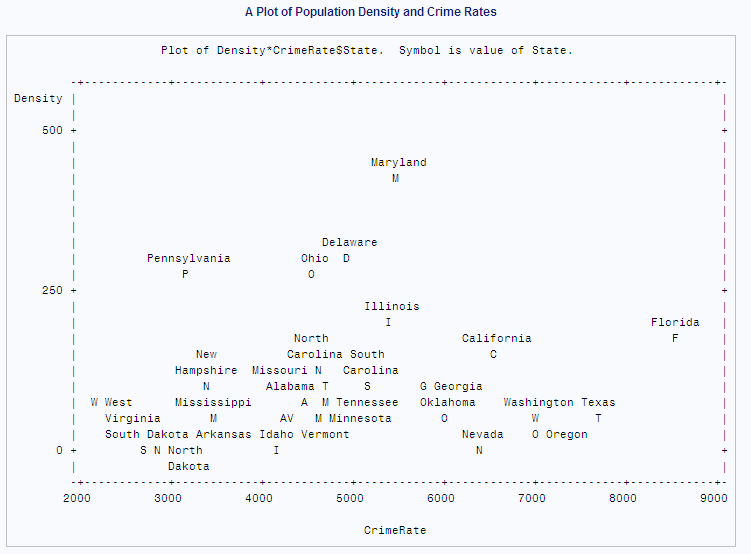
Request a second plot. Because
PROC PLOT is interactive, the procedure is still running at this point
in the program. It is not necessary to restart the procedure to submit
another plot request. LIST=1 produces no output because there are
no penalties of 1 or greater.
Specify placement options. PLACEMENT=
gives PROC PLOT more placement states to use to place the labels.
PLACEMENT= contains three expressions. The first expression specifies
the preferred positions for the label. The first expression resolves
to placement states centered above the plotting symbol, with the label
on one or two lines. The second and third expressions resolve to placement
states that enable PROC PLOT to place the label in multiple positions
around the plotting symbol.