PRINT Procedure
- Syntax

- Overview
- Concepts
- Using
- Examples Selecting Variables to PrintCustomizing Text in Column HeadingsCreating Separate Sections of a Report for Groups of ObservationsSumming Numeric Variables with One BY GroupSumming Numeric Variables with Multiple BY VariablesLimiting the Number of Sums in a ReportControlling the Layout of a Report with Many VariablesCreating a Customized Layout with BY Groups and ID VariablesPrinting All the Data Sets in a SAS Library
Example 3: Creating Separate Sections of a Report for Groups of Observations
| Features: |
BY statement PAGEBY statement |
| Other features: |
SORT procedure FORMAT statement LABEL statement ODS RTF statement TITLE statement |
| Data set: | EXPREV |
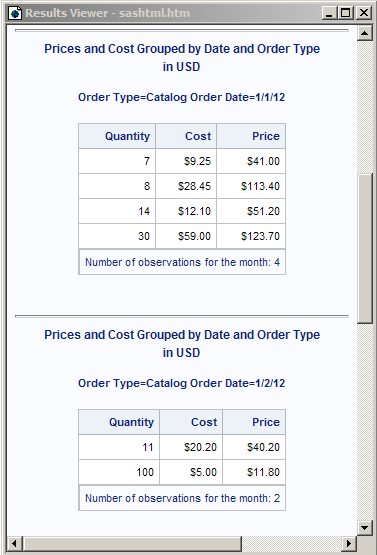
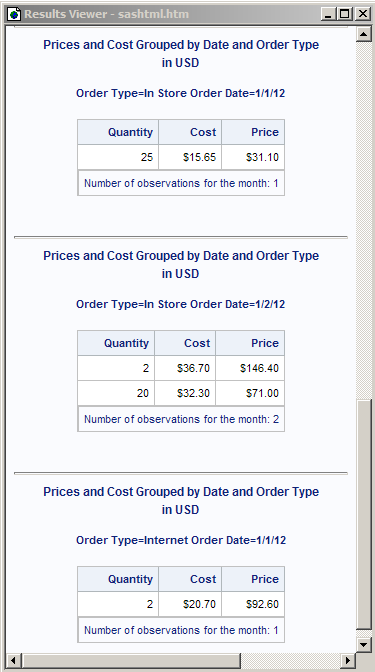
Program: Creating an HTML Report
options nodate pageno=1 obs=10;
proc sort data=exprev;
   by sale_type order_date quantity;
run;
proc print data=exprev n='Number of observations for the month: '
           noobs label;
var quantity cost price;
   by sale_type order_date;
   pageby order_date;
label sale_type='Order Type' order_date='Order Date';
   format price dollar7.2 cost dollar7.2;
   title 'Prices and Cost Grouped by Date and Order Type';
   title2 'in USD';
run;
proc options option=bufno define;
run;
Program Description
Set the SAS system options. The
NODATE option suppresses the display of the date and time in the output.
The PAGENO= option specifies the starting page number. The OBS= option
specifies the number of observations to be displayed.
Print the report, specify the total number of observations
in each BY group, and suppress the printing of observation numbers. N= prints the number of observations in a BY group
at the end of that BY group. The explanatory text that the N= option
provides precedes the number. NOOBS suppresses the printing of observation
numbers at the beginning of the rows. LABEL uses variables' labels
as column headings.
Specify the variables to include in the report. The VAR statement creates columns for Quantity,
Cost, and Price, in that order.
Create a separate section for each order type and specify
page breaks for each BY group of Order_Date. The BY statement produces a separate section of
the report for each BY group and prints a heading above each one.
The PAGEBY statement starts a new page each time the value of Order_Date
changes.
Establish the column headings. The
LABEL statement associates labels with the variables Sale_Type and
Order_Date for the duration of the PROC PRINT step. When you use the
LABEL option in the PROC PRINT statement, the procedure uses labels
for column headings.
Format the columns that contain numbers and specify a
title and footnote. The FORMAT statement
assigns a format to Price and Cost for this report. The TITLE statement
specifies a title. The TITLE2 statement specifies a second title.
Program: Creating an RTF Report
options nodate pageno=1 linesize=80 pagesize=40 obs=10;
ods rtf file='your_file.rtf' startpage=no;
proc sort data=exprev;
   by sale_type order_date quantity;
run;
proc print data=exprev n='Number of observations for each order type:'
noobs label;
var quantity cost price;
   by sale_type order_date;
   pageby order_date;
label sale_type='Order Type' order_date='Order Date';
format price dollar7.2 cost dollar7.2;
title 'Price and Cost Grouped by Date and Order Type';
title2 'in USD';
run;
ods rtf close;Program Description
Create output for Microsoft Word and specify the file
to store the output in. The ODS RTF
statement opens the RTF destination and creates output formatted for
Microsoft Word. The FILE= option specifies the external file that
contains the RTF output. The STARTPAGE=NO option specifies that no
new pages be inserted explicitly at the start of each by group.
proc print data=exprev n='Number of observations for each order type:'
noobs label;
var quantity cost price;
by sale_type order_date;
pageby order_date;
label sale_type='Order Type' order_date='Order Date';
format price dollar7.2 cost dollar7.2;
title 'Price and Cost Grouped by Date and Order Type';
title2 'in USD';
run;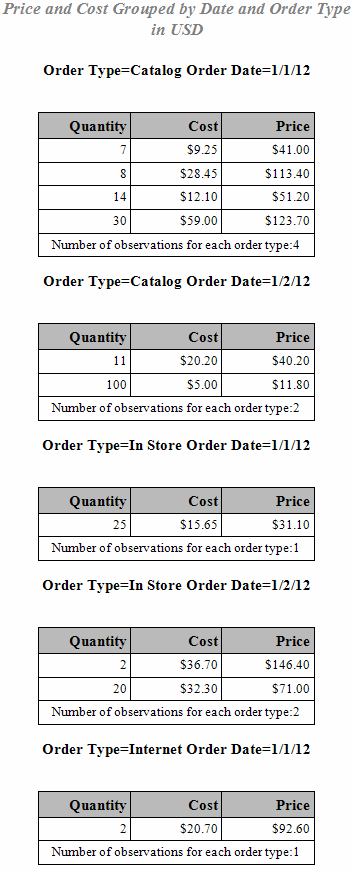
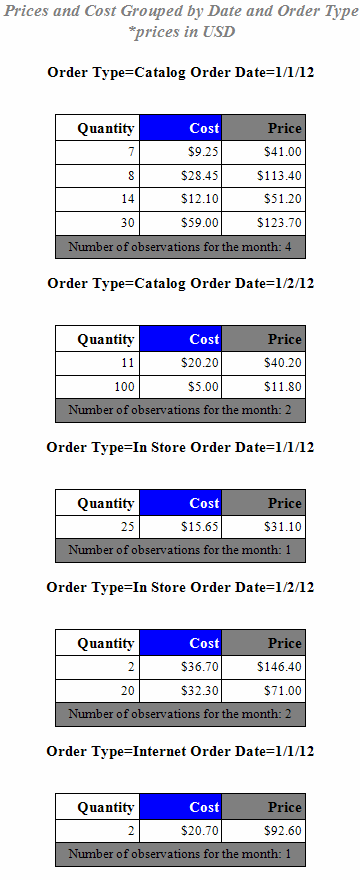
Program: Creating an RTF Report with the STYLE Option
options nodate pageno=1 linesize=80 pagesize=40 obs=10;
ods rtf file='your_file.rtf' startpage=no;
proc sort data=exprev;
   by sale_type order_date quantity;
run;
proc print data=exprev n='Number of observations for the month: '
           noobs label style(N) = {background = gray};
   var quantity / style(header) = [background = white];
   var cost / style(header) = [background = blue foreground =
white];
   var price / style(header) = [background = gray];
   by sale_type order_date;
   pageby order_date;
   label sale_type='Order Type' order_date='Order Date';
   format price dollar7.2 cost dollar7.2;

title 'Prices and Cost Grouped by Date and Order Type';
title2 '*prices in USD';
run;
ods rtf close;Program Description
Create a stylized RTF report. The
first STYLE option specifies that the background color
of the cell containing the number of observations be changed to gray.
The second STYLE option specifies that the background color of the
column heading for the variable Quantity be changed to white. The
third STYLE option specifies that the background color of the column
heading for the variable Cost be changed to blue and the font color
be changed to white. The fourth STYLE option specifies that the background
color of the column heading for the variable Sale_Type be changed
to gray.
proc print data=exprev n='Number of observations for the month: '
           noobs label style(N) = {background = gray};
   var quantity / style(header) = [background = white];
   var cost / style(header) = [background = blue foreground =
white];
   var price / style(header) = [background = gray];
   by sale_type order_date;
   pageby order_date;
   label sale_type='Order Type' order_date='Order Date';
   format price dollar7.2 cost dollar7.2;

title 'Prices and Cost Grouped by Date and Order Type';
title2 '*prices in USD';
run;