IMSTAT Procedure (Analytics)
- Syntax
 Procedure SyntaxPROC IMSTAT (Analytics) StatementAGGREGATE StatementARM StatementASSESS StatementBOXPLOT StatementCLUSTER StatementCORR StatementCROSSTAB StatementDECISIONTREE StatementDISTINCT StatementFORECAST StatementFREQUENCY StatementGENMODEL StatementGLM StatementGROUPBY StatementHISTOGRAM StatementHYPERGROUP StatementKDE StatementLOGISTIC StatementMDSUMMARY StatementNEURAL StatementOPTIMIZE StatementPERCENTILE StatementRANDOMWOODS StatementREGCORR StatementSUMMARY StatementTEXTPARSE StatementTOPK StatementTRANSFORM StatementQUIT Statement
 - Overview
- Using
- Examples Calculating Percentiles and QuartilesRetrieving Box ValuesRetrieving Box Plot Values with the NOUTLIERLIMIT= OptionRetrieving Distinct Value Counts and GroupingPerforming a Cluster AnalysisPerforming a Pairwise CorrelationCrosstabulation with Measures of Association and Chi-Square TestsTraining and Validating a Decision TreeStoring and Scoring a Decision TreePerforming a Multi-Dimensional SummaryFitting a Regression ModelForecasting and Automatic ModelingForecasting with Goal SeekingAggregating Time Series DataTraining and Validating a Neural NetworkPredicting Email Spam and Assessing the ModelTransforming Variables with Imputation and Binning
Example 16: Predicting Email Spam and Assessing the Model
Details
This IMSTAT procedure
example demonstrates using the NEURAL statement to train a neural
network. The ASSESS option is used to generate predicted probabilities
and include them in the scored data. The ASSESS statement is then
used to generate lift and receiver operating characteristic (ROC)
information.
The data set is from
a study on classifying whether an email is junk email (coded as 1)
or not (coded as 0). The data were collected in Hewlett-Packard labs
and donated by George Forman. The data set contains 4,601 observations
with 58 variables. The response variable is a binary indicator of
whether an email is considered spam or not. The 57 variables are continuous
variables that record frequencies of some common words and characters
in emails and lengths of uninterrupted sequences of capital letters.
The data set is publicly available at the UCI Machine Learning repository
(Asuncion and Newman, 2007).
Program
libname example sasiola host="grid001.example.com" port=10010 tag='hps';
%let base = http://archive.ics.uci.edu/ml/machine-learning-databases;
data spambase;
infile "&base/spambase/spambase.data" device=url dsd dlm=',';
input Make Address All _3d Our Over Remove Internet Order Mail Receive
Will People Report Addresses Free Business Email You Credit Your Font
_000 Money Hp Hpl George _650 Lab Labs Telnet _857 Data _415 _85
Technology _1999 Parts Pm Direct Cs Meeting Original Project Re Edu
Table Conference Semicol Paren Bracket Bang Dollar Pound Cap_Avg
Cap_Long Cap_Total Class;
run;
data example.spambase;
set spambase;
part = ranuni(12345);
run;
proc imstat data=example.spambase; 1
where part <= .75;
neural class / seed=12345
input=(make--cap_total)
nominal=(class)
hidden=(10) act=(logistic)
numtries=5 maxiter=50 tech=congra
maxfunc=2147483647 fconv=1e-4
lower=-20 upper=20
temptable /* details */; 2
run;
neural class / seed=12345 3
resume lasrann=example.&_templast_
input=(make--cap_total)
nominal=class
hidden=(10) act=(logistic)
tech=congra maxiter=50
maxfunc=2147483647
fconv=1e-4 lower=-20 upper=20
temptable /* details */;
run;
where part > .75;
neural class / lasrann=example.&_templast_
input=(make--cap_total)
nominal=class
temptable assess 4
vars=(class);
run;
table example.&_templast_;
where strip(_NN_Level_) eq '1';
assess _NN_P_ / y=class event='1' 5
nbins=20 step=0.05;
ods output liftinfo=work.liftdata;
ods output rocinfo=work.rocdata;
quit;
proc sgplot data=work.liftdata; 6
title 'Lift Chart';
series x=depth y=Cumlift /
markers markerattrs=(symbol=circlefilled);
series x=depth y=CumliftBest;
yaxis label=' ' grid;
run;
data work.endpoint; 7
sensitivity=0;
specificity=1;
run;
data work.rocdata1;
set work.rocdata work.endpoint;
one_minus_specificity=1-specificity;
run;
proc sort data=work.rocdata1;
by one_minus_specificity;
run;
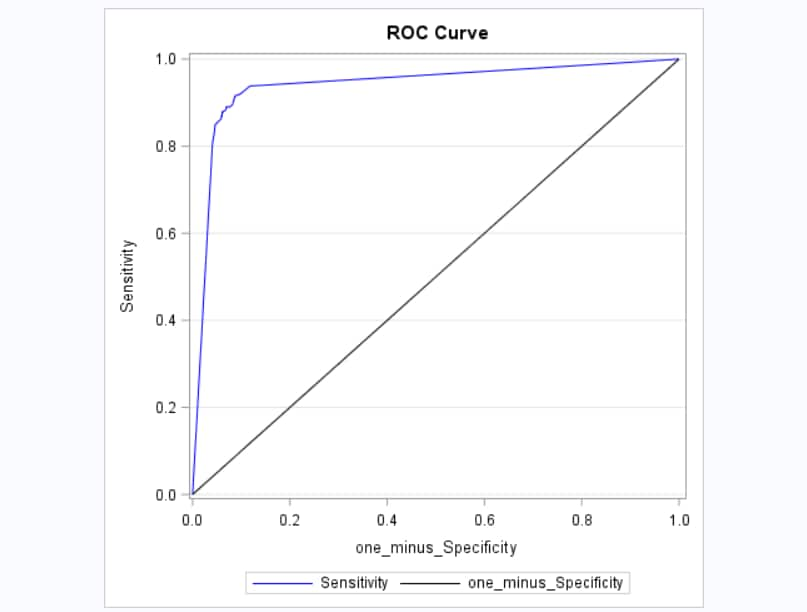
/* Plot ROC curve */
ods graphics on / width=480px height=480px;
proc sgplot data=work.rocdata1; 8
title 'ROC Curve';
series x=one_minus_specificity y=sensitivity /
lineattrs=(color=blue);
series x=one_minus_specificity y=one_minus_specificity /
lineattrs=(color=black);
yaxis grid;
quit;
Program Description
-
The first NEURAL statement is used to pretrain several shallow neural networks, starting from different points to avoid creating a neural network that is ineffective due to poor initial values.
-
The TEMPTABLE option is used to store the parameter estimates from the training in an in-memory table.
-
The second NEURAL statement selects the best neural network from the pretrained neural networks and resumes the analysis to train a much deeper neural network as the final model.
-
The ASSESS option specifies to add predicted probabilities to the scored data for all the levels of the nominal target variable. In this example, two levels are created because the variable named class has two values, 0 or 1. The scored data are stored in a temporary table.
-
The ASSESS statement uses the scoring result to perform model assessment. The probabilities of all levels are output, but we need the probabilities of the event level only. The WHERE clause is used to select the rows with event level only. The strip function is applied to remove the blanks in the character variable _NN_Level_.
-
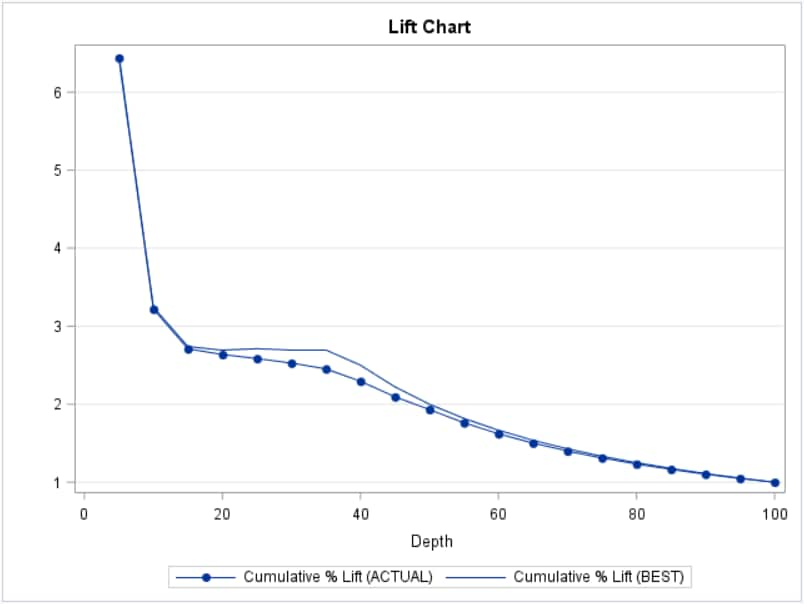
The SGPLOT procedure is used to plot a lift chart.
-
The first DATA step adds the (0, 1) end point to the data set. The results of the ASSESS statement do not always include the end point. The second DATA set adds the end point to the ROC data set and also calculates a new variable.
-
The SGPLOT procedure is used to plot the ROC curve. The ODS WIDTH= and HEIGHT= options are used to ensure that the plot is square.
Output
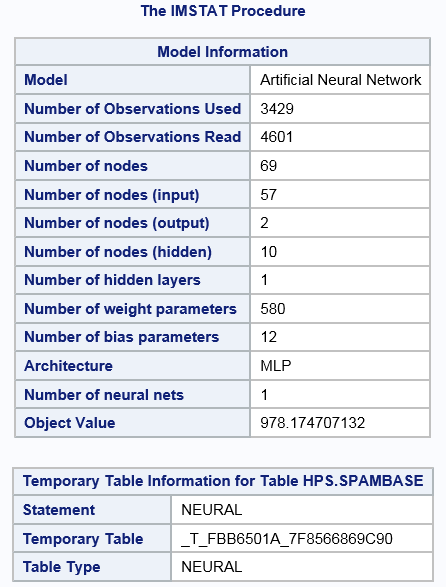
The first display shows
the results of the first NEURAL statement that is used to train the
network.
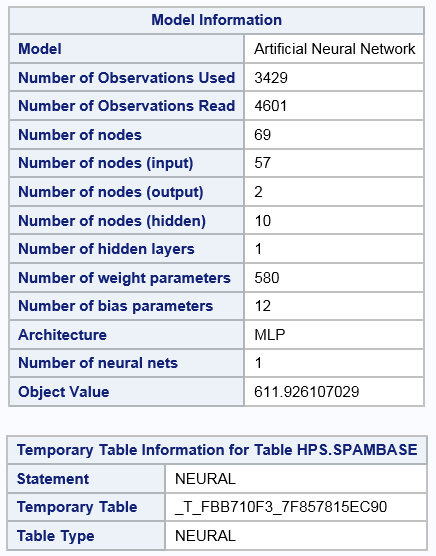
The second display
shows the results of the second NEURAL statement that is used to resume
training and develop a deeper model.
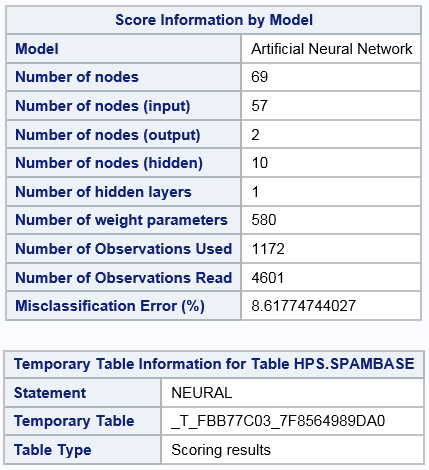
The third display shows
the results of the ASSESS statement that provides the scoring results.
Two additional ODS tables are created, a lift information table and
a ROC information table. These are not shown here because the tables
are wide.
The following two displays
show the lift chart and the ROC curve for the scoring results.
Copyright © SAS Institute Inc. All Rights Reserved.