Introduction to Legend Management

Some of the Uses for a Legend

A graphical legend provides a key to the marker symbols, lines, and other data elements that are displayed in a graph. Here are some of the situations where legends are useful:
  • when a plot contains grouped markers (scatter plots, for example)
  • when a plot contains lines that differ by color, marker symbol, or line pattern (series plots or step plots, for example)
  • when a plot contains one or more lines or bands that require identification or explanation
  • when series plots with different data are overlaid in the graph, or fit lines are displayed with confidence bands, or density plots with different distributions are generated
  • when markers vary in color to show the values of a response variable
  • when contour or surface plots use gradient fill colors to show the values of a response variable.
GTL does not automatically generate legends for the above situations. However, the mechanism for creating legends is simple and flexible.

Types of Legends in GTL

GTL supports two legend statements:
DISCRETELEGEND
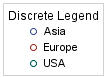
legend that contains one or more legend entries. Each entry consists of a graphical item (marker, line, ...) and corresponding text that explains the item. A discrete legend would be used for the first two situations listed in Some of the Uses for a Legend.
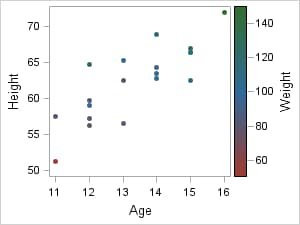
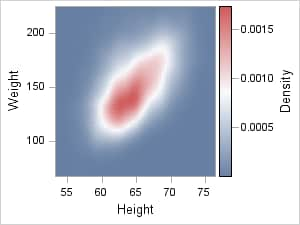
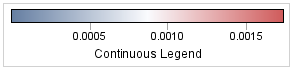
Example of a Discrete Legend
CONTINUOUSLEGEND
legend that maps a color gradient to response values. A continuous legend would be used for the last two situations listed in Some of the Uses for a Legend.
Example of a Continuous Legend

General Syntax for Using Legends

Regardless of the situation, the basic strategy for creating legends is to "link" one or more plot statements to a legend statement by assigning a unique, case-sensitive name to the plot statement and then referencing that name on the legend statement:
plot-statement . . . / name="id-string1" ;

plot-statement . . . / name="id-string2" ;

legend-statement  "id-string1"  "id-string2"  < / options > ;
One way of thinking about this syntax is that you can identify any plot with a NAME= option, and you can then selectively include plot names on a legend statement. This enables the legend to query the identified plots so that it can get the information that it needs to build the legend entries.
Note: When the legend statement includes the name of a plot, it does not always mean that the legend will include an entry for that plot. For example, a block plot with FILLTYPE=ALTERNATE does not show up in a legend.

Example Legend Coding for Common Situations

Show Group Values in a Legend

The appearance of the markers is automatically determined by the current style. The order of the legend entries is controlled by the data order.
layout overlay;
  scatterplot x=height y=weight / group=sex name="scatter";
  discretelegend "scatter";
endlayout;
Group Values in a Legend

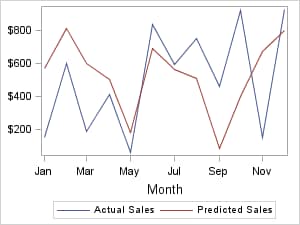
Identify Overlaid Plots in a Legend

This example illustrates that more than one plot can contribute to a legend. The order of the names in the DISCRETELEGEND statement controls the order of the legend entries. For more information about the CYCLEATTRS= option, see Ordering the Legend Entries for Non-grouped Plots.
layout overlay / cycleattrs=true;
  seriesplot x=month y=actual    / name="sp1";
  seriesplot x=month y=predicted / name="sp2";
  discretelegend "sp1" "sp2";
endlayout;
A Legend that Identifies Overlaid Plots
In this case, the default legend entry text was determined by the label for the Y= variable of each plot. You could set the legend entry text explicitly by specifying LEGENDLABEL="string" on each plot statement.

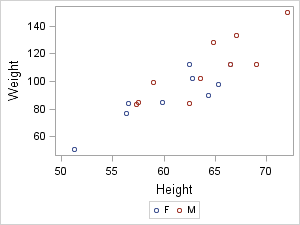
Show Group Values and Identify Plots in a Legend

A legend can show group values for multiple groups and identify one or more plots.
layout overlay;
  scatterplot x=height y=weight / group=sex name="scatter";
  loessplot x=height y=weight / name="Loess";
  discretelegend "Loess" "scatter";
endlayout;
Identifying Group Values in the Legend
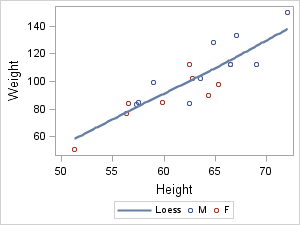
If a plot variable does not have a variable label, the case-sensitive plot name is used for the legend label. In this case, because the Y= variable of the LOESSPLOT statement does not have a variable label, the plot name "Loess" is used. You could also set the legend entry text explicitly by setting LEGENDLABEL="string" in the LOESSPLOT statement.

Show a Legend for a Continuous Response Variable (scatter plot)

This example shows how marker color in a scatter plot can represent the values of a response variable (WEIGHT in this case).
layout overlay;
  scatterplot x=age y=height / markercolorgradient=weight name="sc"
    markerattrs=(symbol=circlefilled);
  continuouslegend "sc" / title="Weight";
endlayout;
Legend for a Continuous Response Variable

Show a Legend for a Continuous Response Variable (contour plot)

This example shows how a fill color gradient in a contour can represent values of a response variable (DENSITY in this case)
layout overlay;
  contourplotparm x=height y=weight z=density /
    contourtype=gradient name="con";
  continuouslegend "con" / title="Density";
endlayout;
Legend for a Continuous Response Variable