Features of Discrete Legends
Placing the Legend
Ordering the Legend Entries for a Grouped Plot
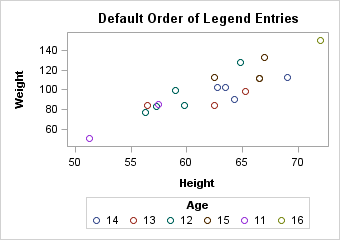
Overview of the Group Value Default Order
When the GROUP=column option is used with a plot, the unique
values of column are presented
in the legend in the order in which they occur in the data.
proc template;
 define statgraph order;
  dynamic TITLE;
  begingraph;
   entrytitle TITLE;
   layout overlay;
    scatterplot x=height y=weight / name="sp"
      group=age ;
    discretelegend "sp" / title="Age";
   endlayout;
  endgraph;
 end;
run;

proc sgrender data=sashelp.class template=order;
  dynamic
    title="Default Order of Legend Entries";
run;
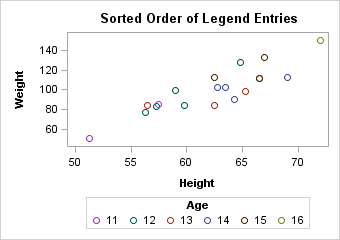
Sorting the Legend Items
You use the SORTORDER= option in
your DISCRETELEGEND statement to perform a linguistic sort on the
legend items in ascending or descending order. By default, SORTORDER=AUTO,
which displays the items in the order in which they are provided by
the contributing plots.
Note: The SORTORDER= option overrides
the ordering that is established by the GROUPORDER= option in the
legend's constituent plot statements. The SORTORDER=ASCENDINGFORMATTED
or SORTORDER=DESCENDINGFORMATTED options combine the entries from
the contributing plots and orders them as a single list.
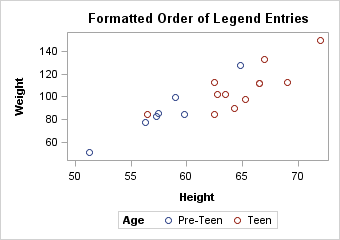
Formatting the Data
You can apply a format
to a group column to change the legend entry labels or the number
of classification levels. The ordering of the legend entries is based
on the order of the pre-formatted group values. In the following
example, the data is sorted in ascending order, so the legend entry
order is "Pre-Teen" "Teen" "Adult." Because there are no adults,
"Adult" does not appear in the graph. If the data were sorted in descending
age order the legend entry order would be reversed.
proc format;
  value teenfmt
  low-12  = "Pre-Teen"
  13-19   = "Teen"
  20-high = "Adult";
run;

proc sort data=sashelp.class out=class;
  by age;
run;

proc sgrender data=class template=order;
  format age teenfmt.;
  dynamic
    title="Formatted Order of Legend Entries";
run;
In a GTL template, the
plot statement, not the legend statement, defines the association
of grouped data values with colors, symbols, and line patterns. The
association is simply reflected in the legend entries. To change the
mapping between grouped data values and the associated style elements,
use the INDEX=column option
on the plot statement. For a discussion of the INDEX= option, see Managing Graph Appearance: General Principles.
Ordering the Legend Entries for Non-grouped Plots
Varying Visual Properties
In the following examples,
the CYCLEATTRS=TRUE setting is used as a quick way to change the visual
properties of each plot without explicitly setting it. When CYCLEATTRS=TRUE,
any plots that derive their default visual properties from one of
the GraphData elements are cycled through those elements for deriving
visual properties. So, the first plot gets its visual properties from
the GraphData1 style element, the next plot gets its properties from
the GraphData2 style element, and so on. When plot lines represent
entities such as fit lines or confidence bands, it is recommended
that you use options such as LINEATTRS= or OUTLINEATTRS= and specify
appropriate style elements. For example, you might specify
LINEATTRS=GraphFit or OUTLINEATTRS=GraphConfidence.
Assigning Legend Entry Labels
Every GTL plot type
(except box plot) has a default legend entry label. For example, for
some X-Y plots, the default entry legend label is the label of the
Y= column (or the column name if no label is assigned).
To assign a legend entry
label for a plot, you can use a LABEL statement with PROC SGRENDER,
or use the LEGENDLABEL="string" option on the plot statement.
layout overlay / yaxisopts=(label="Sales")
                 cycleattrs=true;
  seriesplot x=month y=actual / name="a"
             legendlabel="Actual" ;
  seriesplot x=month y=predict / name="p"
             legendlabel="Predicted" ;

  discretelegend "a" "p"/  valign=bottom;
endlayout;
Note: Other techniques are available
for labeling plots without using a legend. Many plots that render
one or more lines support a CURVELABEL= option that places text inside
or outside of the plot wall to label the line(s). These plots include
SERIESPLOT, STEPPLOT, DENSITYPLOT, REGRESSIONPLOT, LOESSPLOT, PBSPLINEPLOT,
MODELBAND, BANDPLOT, LINEPARM, REFERENCELINE, and DROPLINE. Additional
options are available to control curve label location, position, and
text properties. For examples, see Managing Graph Appearance: General Principles and Adding and Changing Text in a Graph.
Arranging Legend Entries into Columns and Rows
Default Legend Item Arrangement
The arrangement of the
entries in a legend is affected by the number of entries in the legend,
the length of the entry labels, and the size of the graph. When the
graph is wide enough, all legend information can fit into one row
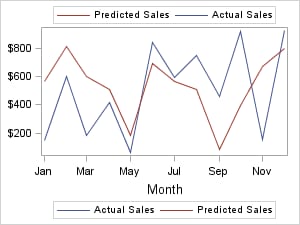
as shown in the following figure.
Note: When all the legend entries
and the legend title fit in one row, the legend title is drawn on
the left as shown in the following graph. This is done to conserve
the vertical space that is used by the legend.
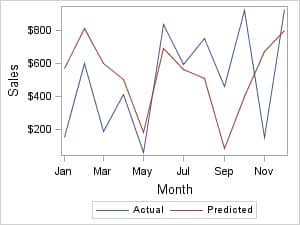
When the legend entries and the legend
title cannot fit into one row, the legend title and entries are wrapped
into multiple rows in order to fit the allotted space. In the following
graph, the width of the graph is reduced to the point where it causes
the legend entries to wrap into an additional row. Because the legend
needs this extra row, the height of the plot wall must be reduced,
leaving less room for the data display. Also, because the legend entries
and title do not fit in one row, the title is now drawn above the
legend entries.
Options to Control Legend Wrapping
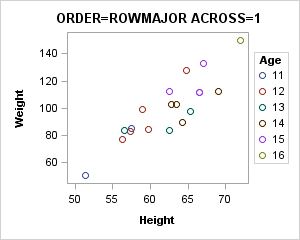
Organizing Legend Entries in a Fixed Number of Columns
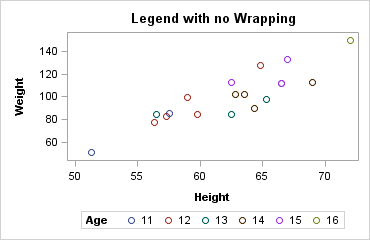
For legends with left
or right horizontal alignment, a vertical orientation of legend entries
works best because it allows the most space for the plot area. In
such cases, you typically want to set a small fixed number of columns
for the legend entries and let the entries wrap to a new row whenever
necessary. This entails setting ORDER=ROWMAJOR and an ACROSS= value.
In the following example, ACROSS=1 means "place all entries in one
column, and start as many new rows as necessary."
layout overlay;
  scatterplot x=Height y=Weight / name="sp"
    group=age;
  discretelegend "sp" / title="Age"
    halign=right valign=center
    order=rowmajor across=1 ;
endlayout;
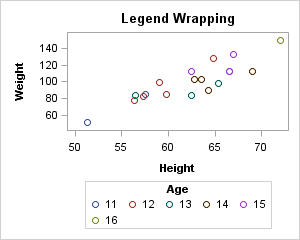
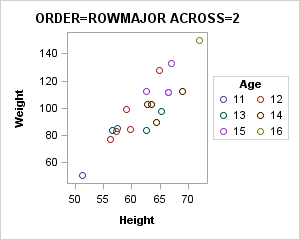
As you increase the
number of columns, the plot area decreases. In the following example,
ACROSS=2 means "place all entries in two columns left to right, and
start as many new rows as necessary."
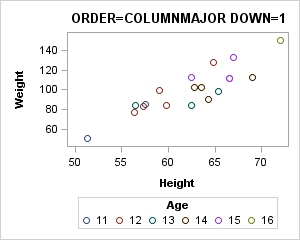
Organizing Legend Entries in a Fixed Number of Rows
For legends with a top
and bottom alignment, a horizontal orientation of legend entries works
best. In such cases, you typically want to set a small fixed number
of rows for the legend entries and let the entries wrap to a new column
whenever necessary. This entails setting ORDER=COLUMNMAJOR and a
DOWN= value. In the following example, DOWN=1 means "place all entries
in one row, and start as many new columns as necessary."
layout overlay;
  scatterplot x=Height y=Weight / name="sp"
    group=age;
  discretelegend "sp" / title="Age"
    order=columnmajor down=1 ;
endlayout;
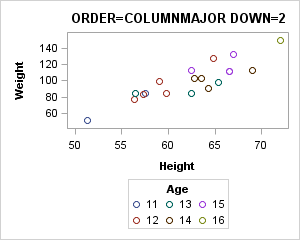
As you increase the
number of rows, the plot area decreases. In the following example,
DOWN=2 means "place all entries in two rows top to bottom, and start
as many new columns as necessary."
Controlling the Label and Item Size
To control the size of the labels
in your legend, include the SIZE= option in the VALUEATTRS= option
list in the DISCRETELEGEND statement. By default, the size of the
items in the legend, such as markers, filled squares, and filled bubbles,
remain fixed regardless of the label font size. When you increase
the label font size, the labels can appear out of proportion with
the items. You can include the AUTOITEMSIZE=TRUE option in your DISCRETELEGEND
statement to automatically size markers, filled squares, and filled
bubbles in proportion to the label font size. The AUTOITEMSIZE= option
does not affect line items. When AUTOITEMSIZE=TRUE, if you change
the label font size, any markers, filled squares, and filled bubbles
in the legend are automatically resized to maintain proportion with
the resized labels. Here is an example that specifies a discrete legend
that has 12-point labels and markers that are sized proportionately
to the labels.
Adding and Removing Items from a Discrete Legend
Adding Items to a Legend
You can use the LEGENDITEM statement
to manually add items to your legend that do not appear in your plot.
This enables you to provide additional information about your plot
or to build a common legend that you can use with multiple plots.
The syntax of the LEGENDITEM statement is as follows:
You must place the LEGENDITEM
statement in the global definition area of the template between the
BEGINGRAPH statement and the first layout statement. The TYPE=EntryType option specifies the type of entry
that you want to add to your legend. EntryType can be one of the following:
| LINE |
| MARKER |
| MARKERLINE |
| TEXT |
Use options to set the
desired appearance for the entry, such as color, pattern, font, and
so on. Note the following about the LEGENDITEM statement:
-
You can specify any supported set of attributes for a legend item regardless of its type. However, sets of attributes that are not applicable to the legend item type are ignored. For example, in the LEGENDITEM statement, if TYPE=FILL and the MARKERATTRS=( ) option is specified, the MARKERATTRS=( ) option is ignored.
Here is an example of
a LEGENDITEM statement that adds item 17 to the legend of a height-to-weight
chart that is grouped by age. The new item uses a red-filled star
as a marker.
proc template;
   define statgraph additem;
   dynamic legenditem;
      BeginGraph;
         entrytitle "Height vs. Weight By Age";
         legenditem  type=marker name="newitem" / label="17"
            lineattrs=(color=red)
            markerattrs=(symbol=starfilled color=red);
         layout overlay;
            scatterplot x=height y=weight / group=age
               name="heightweight";
            discretelegend "heightweight" "newitem";
         endlayout;
      EndGraph;
   end;
run;

proc sgrender data=sashelp.class template=additem;
run;
Notice that the DISCRETELEGEND
statement specifies the name specified in the NAME= option in each
of the SCATTERPLOT and LEGENDITEM statements. This combines the new
legend item and the automatically generated plot legend into one legend.
In this example, the new item 17 and its red-filled star marker are
appended to the existing items in the legend. You can include multiple
LEGENDITEM statements to add multiple items to your legend.
Removing Items from a Legend
To remove one or more items from
your legend, use the EXCLUDE= option on your DISCRETELEGEND statement.
The EXCLUDE= specifies the label of each item that is to be removed
as follows:
Filtering Items That Are Contributed by Multiple Plot Statements
When multiple plot statements contribute to the legend, you can use
the TYPE= option in your DISCRETELEGEND statement to include only
items of a specific type. You can specify one of the following item
types:
| ALL | LINE | MARKER |
| FILL | LINECOLOR | MARKERCOLOR |
| FILLCOLOR | LINEPATTERN | MARKERSYMBOL |
Note: If no entries match the type
specified by the TYPE= option, a legend is not drawn in the plot.
Here is an example that
includes only marker entries in a legend for a series plot that displays
both the lines and markers.
proc template;
define statgraph plots;
begingraph;
   entrytitle "Closing Price and Volume for 2002";
   Layout overlay;
       seriesplot x=date y=close / group=stock name="plot1" display=all;
       discretelegend  "plot1" / title="Stock" type=marker;
   endLayout;
endgraph;
end;
run;

proc sgrender data=sashelp.stocks template=plots;
   where date between '01JAN2002'd AND '31DEC2002'd;
run;
Merging Legend Items from Two Plots into One Legend
You can
use the MERGEDLEGEND statement to merge the legend items from two
grouped plots into one legend. The basic syntax is as follows:
The options used with
the MERGEDLEGEND statement are similar to those that are used with
the DISCRETELEGEND statement. The following restrictions apply to
the MERGEDLEGEND statement:
During the merge process,
the group values from both plots are compared. The legend symbols
for duplicate group values are combined into one legend item, which
is then combined with the unique items into one legend. If the items
cannot be merged, the following warning message appears in the SAS
log:
WARNING: MERGEDLEGEND statement does not reference two plots whose legend
items can be properly merged. The legend will not be displayed.
If you receive this
message, verify that both of the contributing plots are grouped plots
that use line and marker overlays. Here is an example that overlays
a series plot and a scatter plot, and combines the plot symbols into
one merged legend and one discrete legend that are displayed side-by-side
for comparison.
proc template;
define statgraph plots;
begingraph;
   entrytitle "Closing Price and Volume for 2002";
   Layout overlay /
       xaxisopts=(griddisplay=on gridattrs=(color=lightgray pattern=dot))
       yaxisopts=(griddisplay=on gridattrs=(color=lightgray pattern=dot));
       seriesplot x=date y=close / group=stock name="plot1";
       scatterplot x=date y=volume / group=stock name="plot2" yaxis=y2;
       discretelegend  "plot1" "plot2" / title="Discrete Legend"
          across=2 down=3 valign=bottom order=columnmajor halign=left;
       mergedlegend "plot1" "plot2" / title="Merged Legend"
          sortorder=ascendingformatted across=1 valign=bottom halign=right;
   endLayout;
endgraph;
end;
run;

proc sgrender data=sashelp.stocks template=plots;
   where date between '01JAN2002'd AND '31DEC2002'd;
run;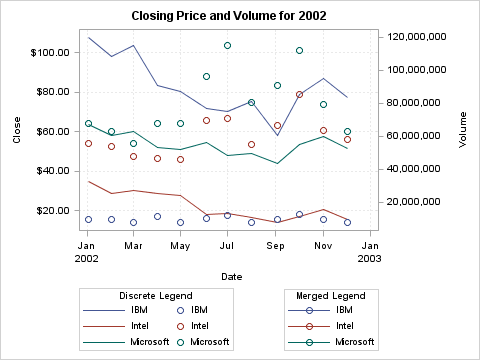
In this example, the
SERIESPLOT statement creates a series plot of the closing stock prices
grouped by stock. The SCATTERPLOT statement creates a scatter plot
of the trading volume grouped by stock. Notice that both plots are
grouped, and exactly two plot names are used in the MERGEDLEGEND statement.
As shown in this example, the discrete legend consists of two entries
for each stock, one from each of the plots. Because SORTORDER= defaults
to AUTO in this case, the items from each plot appear in the order
in which they occur in the data. In contrast, the merged legend consists
of only one entry for each stock, which is a combination (overlay)
of the entries from both plots. You can use the SORTORDER= option
in the MERGEDLEGEND statement to sort the items in the merged legend.
In this case, because the data is already sorted, SORTORDER=ASCENDINGFORMATTED
and SORTORDER=AUTO have the same effect.
Creating a Global Legend
When multiple discrete legends are used, you can use
a LAYOUT GLOBALLEGEND block to combine all of the discrete and merged
legends into one global legend. The following restrictions apply to
global legends:
To combine your legends
into one global legend, include all of the DISCRETELEGEND and MERGEDLEGEND
statements in your LAYOUT GLOBALLEGEND block. The resulting global
legend is placed at the bottom of the graph just above the footnotes.
You can use the TITLE= option to add a title for the global legend.
You can also use the TITLE= option on each of the DISCRETELEGEND or
MERGEDLEGEND statements to add titles for the individual legends.
Use the LEGENDTITLEPOSITION = option to specify the position of the
individual legend titles.
The TYPE= option specifies
whether the legends are arranged in a column or a row. When you specify
TYPE=ROW, you can use the WEIGHTS= option to specify the amount of
space that is available for each of the legends. The WEIGHTS= option
can be one of the following values:
weight-list
specifies
a space-delimited list of PREFERRED or number keywords where each keyword corresponds to a nested legend.
specifies a proportional
weight for the corresponding legend, which determines the percentage
of the available space that the legend gets. The total of the values
does not need to be 1. When PREFERRED and number keywords are used together, the PREFERRED legends are given their
preferred space. The remaining space is divided among the number legends based on their weighted values.
proc template;
define statgraph foo;
begingraph;
   layout lattice;
      entrytitle "Asian Makes - MSRP  Under $15,000";
      Layout overlay / xaxisopts=(display=(ticks tickvalues line))
         yaxisopts=(griddisplay=on gridattrs=(color=lightgray pattern=dot));
         barchart x=type y=mpg_city / group=make name="bar"
            stat=mean groupdisplay=cluster barwidth=0.75;
      endLayout;
      Layout overlay / xaxisopts=(display=(ticks tickvalues line))
	     yaxisopts=(griddisplay=on gridattrs=(color=lightgray pattern=dot));
         scatterplot x=make y=msrp / group=type name="scatter";
      endLayout;
   endlayout;
   layout globallegend / type=row weights=preferred legendtitleposition=top;
      discretelegend "bar" / across=3
         title="Make" titleattrs=(weight=bold);
      discretelegend "scatter" / sortorder=ascendingformatted
         title="Type" titleattrs=(weight=bold);
   endlayout;
endgraph;
end;
run;

proc sgrender data=sashelp.cars template=foo;
  where origin="Asia" && msrp <= 15000;
run;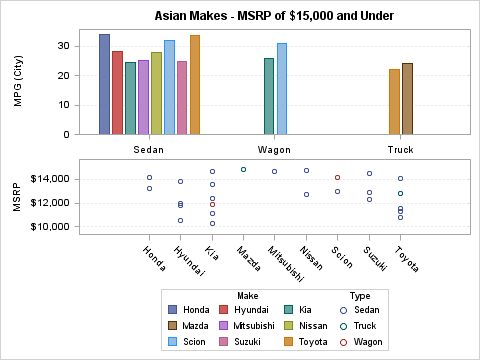
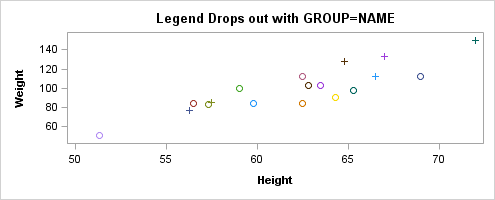
When Discrete Legends Get Too Large
As a discrete legend
gets more entries or as the legend entry text is lengthy, the legend
grows and the plot wall shrinks to accommodate the legend's size.
At some point, the plot wall becomes so small that it is useless.
For that reason, whenever all the legends in a graph occupy more than
20% of the total area of the graph, the larger legends are dropped
as needed from the graph to keep the legend area at 20% or less of
the graph area. For example, the following code generates only one
legend, but that legend would occupy more than 20% of the total area
of the graph, so the legend is dropped and the plot is rendered as
if no legend were specified.
proc template;
 define statgraph legendsize;
  begingraph;
    entrytitle "Legend Drops out with GROUP=NAME";
    layout overlay;
      scatterplot x=Height y=Weight / name="sp" group=name;
      discretelegend "sp" / title="Name" across=2 halign=right;
    endlayout;
  endgraph;
 end;
run;

proc sort data=sashelp.class out=class; by name; run;

proc sgrender data=class template=legendsize;
run;
NOTE: Some graph legends have been dropped due to size constraints. Try adjusting
      the MAXLEGENDAREA=, WIDTH= and HEIGHT= options in the ODS GRAPHICS
      statement.
In such cases, you can use the WIDTH= and HEIGHT= options
in the ODS GRAPHICS statement to increase the graph area so that at
some point the legend is displayed.
Another alternative is to use the MAXLEGENDAREA=
option to change the threshold area for when legends drop out. The
following specification allows all legends to occupy up to 40% of
the graph area:
ods graphics / maxlegendarea=40;
proc sgrender data=class template=legendsize;
run;
However, changing the
total area that is allotted to legends might not resolve the problem
if the specified legend organization does not fit in the existing
size. In these cases, the legend might not be displayed and you would
see the following log message:
WARNING: DISCRETELEGEND statement with DISPLAYCLIPPED=FALSE is getting clipped.
         The legend will not be drawn.
To investigate this problem, you
can specify DISPLAYCLIPPED=TRUE in the DISCRETELEGEND statement, which
forces the legend to display so that you can visually inspect it.
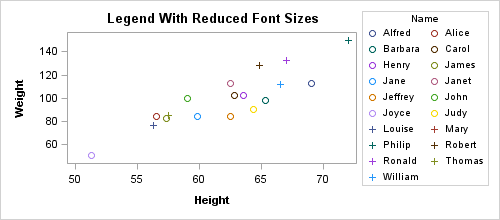
discretelegend "sp" / title="Name" across=2 halign=right displayclipped=true ;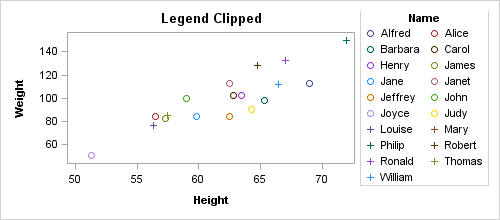
In the current example,
it is apparent that the height chosen for the output is not large
enough to display the title and all legend entries in two columns.
The problem can be fixed in any of the following ways:
To change the font sizes of the legend entries, use the
VALUEATTRS= option on the legend statement. To change the font size
of the legend title, use the TITLEATTRS= option. Normally, the legend
entries are displayed in 9pt font, and the legend title is displayed
in 10pt font. The following example reduces the size of legend text: