General Legend Features
The following sections discuss several features that
are common to both discrete legends and continuous legends.
Positioning Options
Overview of the Legend Placement Options
You can include a legend
statement in most layout blocks. Most of the time you would simply
like to ensure that the legend appears where you want in relation
to the plot(s) of the graph. The issues differ, depending on whether
you define a single-cell graph or a multi-cell graph. This section
discusses single-cell graphs. The discussion of legend placement for
multi-cell layouts such as GRIDDED, LATTICE, DATALATTICE, and DATAPANEL
appears in the appropriate layout chapter:
-
Using a Simple Multi-cell Layout (GRIDDED)
-
Using an Advanced Multi-cell Layout (LATTICE)
-
Using Classification Panels (DATAPANEL, DATALATTICE, PROTOTYPE)
The following positioning
options control a legend's location within its parent layout. They
are available only when the legend is nested within an overlay-type
layout:
Displaying Legends Outside of the Plot Wall
When you place a legend
statement in a single-cell layout such as OVERLAY, OVERLAYEQUATED,
or OVERLAY3D, the default legend appears outside the plot wall but
inside the layout border:
layout overlay;
  scatterplot X=Height Y=Weight /
    name="sp" group=sex;
  discretelegend "sp" /
    location=outside
    halign=center valign=bottom ;
endlayout;
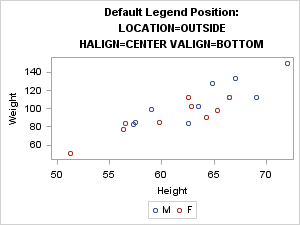
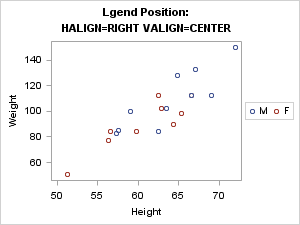
Using the HALIGN= and
VALIGN= options, you can place a legend in eight positions outside
the plot wall. The only combination that is not supported is HALIGN=CENTER
and VALIGN=CENTER. To accommodate the legend, the size of the plot
wall is adjusted so that the legend(s) can be displayed.
Note: Sometimes with large legends,
this size adjustment causes problems. Sizing issues are discussed in Arranging Legend Entries into Columns and Rows and When Discrete Legends Get Too Large.
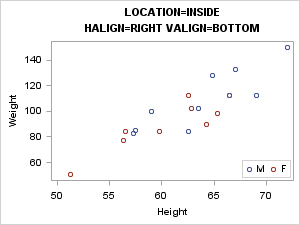
Displaying Legends Inside the Plot Wall
A legend can be placed
inside the plot wall (LOCATION=INSIDE) and positioned with the HALIGN=
and VALIGN= options. Nine inside positions are possible. The defaults
are HALIGN=CENTER and VALIGN=CENTER. The following example positions
the legend in the inside bottom right location.
Automatically Aligning an Inside Legend
When the plot statements are specified in a 2-D overlay-type
layout, the AUTOALIGN= option can be used to automatically position
an inside legend. AUTOALIGN= selects a position that avoids or minimizes
collision with plot components.
The AUTOALIGN= option
enables you to specify an ordered list of potential positions for
the legend. The list contains one or more of the following keywords:
TOPLEFT, TOP, TOPRIGHT, LEFT, CENTER, RIGHT, BOTTOMLEFT, BOTTOM, and
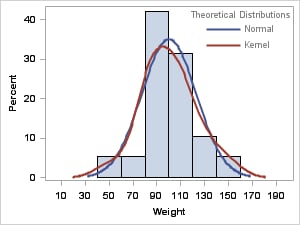
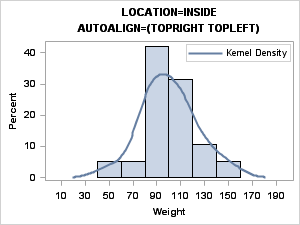
BOTTOMRIGHT. In the following example, we know that the best position
for an inside legend is TOPRIGHT or TOPLEFT. Because the AUTOALIGN=
option specifies a list of preferred positions, the first of the listed
positions that does not involve data collision is used. Had the histogram
been skewed to the right, the TOPLEFT position would be used.
layout overlay;
  histogram Weight / name="sp";
  densityplot Weight / kernel()
    legendlabel="Kernel Density"
    name="kde";
  discretelegend "kde" /
    location=inside
    autoalign=(topright topleft) ;
endlayout;
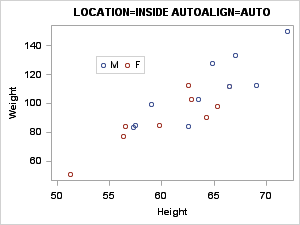
When the parent layout
contains only scatter plots, you can fully automate the selection
of an internal position by specifying AUTOALIGN=AUTO. This is a "smart"
option that automatically selects a position where there is no (or
minimal) collision with plot components. The AUTOALIGN=AUTO option
selects a position for you. Note that positions that are not possible
with HALIGN= and VALIGN= might be used.
layout overlay;
  scatterplot X=Height Y=Weight / name="sp" group=sex;
  discretelegend "sp" / location=inside autoalign=auto ;
endlayout;
General Appearance Options
Using Background Transparency and Color
The following options
control the appearance of the legend background:
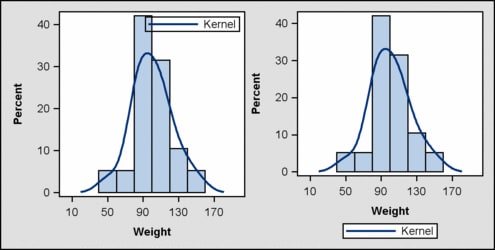
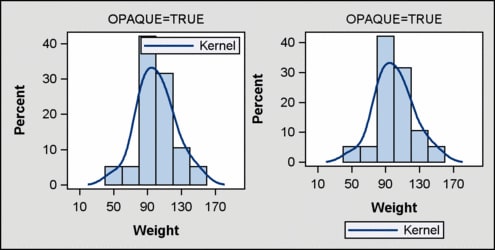
By default, OPAQUE=FALSE
when LOCATION=INSIDE. This minimizes the potential for the legend
to obscure the markers, lines, fills, and labels in the plot area.
when When LOCATION=OUTSIDE, OPAQUE=TRUE by default. This enables the
legend background color to appear. Typically, the default legend background
color is the same as the plot wall background color. The following
graph illustrates the default settings (the graph uses the DEFAULT
style, which has a gray graph background):
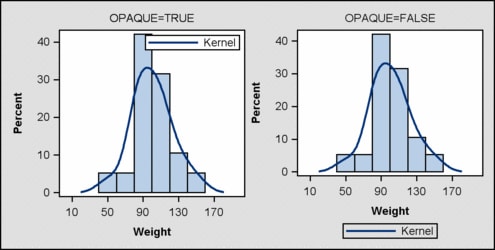
The next graph illustrates
how the graph looks when the default opacity is reversed. With reverse
opacity, the default background color of an inside legend is the same
as the fill color of the plot wall that is behind it. For outside
legends, the default background color is 100% transparent, so the
graph background color shows through the legend.
When the legend background is opaque, you can use the BACKGROUNDCOLOR=
option to set its color. In the following example, BACKGROUNDCOLOR=GraphAltBlock:Color
for both the inside and outside opaque legends. Other style references
you could use include GraphHeaderBackground:Color, GraphBlock:Color,
or any other style element with a COLOR= attribute. You can also specify
a specific color, such as BACKGROUNDCOLOR=white.
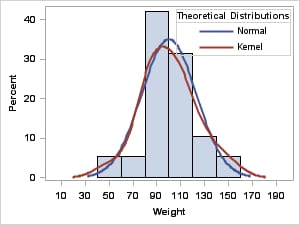
Using a Legend Title and Title Border
By default, legends
do not have titles. To add a title, you can use the TITLE= option.
You can also add a dividing line between the legend title and the
legend body with the TITLEBORDER=TRUE setting.
layout overlay;
  histogram Weight / name="sp";
    densityplot Weight / normal()
      legendlabel="Normal" name="norm"
      lineattrs=GraphData1;
    densityplot Weight / kernel()
      legendlabel="Kernel" name="kde"
      lineattrs=GraphData2;
    discretelegend "norm" "kde" /
      location=inside across=1
      autoalign=(topright topleft)
      title="Theoretical Distributions"
      titleborder=true ;
endlayout;
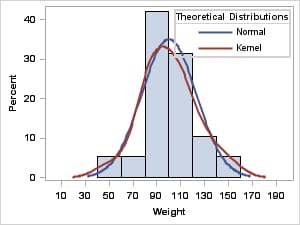
Legend Border
By default, a border
is displayed around a legend. You can remove the border by specifying
BORDER=FALSE (which also removes the title border). The line properties
of a legend border can be set by the BORDERATTRS= option. The following
example modifies the legend border so that it is thicker than the
title border:
layout overlay;
  histogram Weight / name="sp";
    densityplot Weight / normal()
      legendlabel="Normal" name="norm"
      lineattrs=GraphData1;
    densityplot Weight / kernel()
      legendlabel="Kernel" name="kde"
      lineattrs=GraphData2;
    discretelegend "norm" "kde" /
      location=inside across=1
      autoalign=(topright topleft)
      title="Theoretical Distributions"
      titleborder=true
      borderattrs=(thickness=2) ;
endlayout;
Legend Text Properties
The TITLEATTRS= and
VALUEATTRS= options control the text properties of the legend. By
default, the text properties come from the current style. The legend
title uses
TITLEATTRS = GraphLabelText,
and legend entries use VALUEATTRS = GraphValueText. For visual consistency in the graph, the GraphLabelText style element
is also used for axis labels, and the GraphValueText style element
is also used for axis tick values. In general, style elements are
used as needed in a graph to maintain visual consistency.
The following example
sets all legend text to gray. The font for the legend title is made
the same as the default font for the legend values by setting TITLEATTRS=GraphValueText.
layout overlay;
  histogram Weight / name="sp";
    densityplot Weight / normal()
      legendlabel="Normal" name="norm"
      lineattrs=GraphData1;
    densityplot Weight / kernel()
      legendlabel="Kernel" name="kde"
      lineattrs=GraphData2;
    discretelegend "norm" "kde" /
      location=inside across=1
      autoalign=(topright topleft)
      title="Theoretical Distributions"
      border=false valueattrs=(color=gray)
      titleattrs=GraphValueText(color=gray) ;
endlayout;