To change axis properties:
-
Right-click an axis
and select
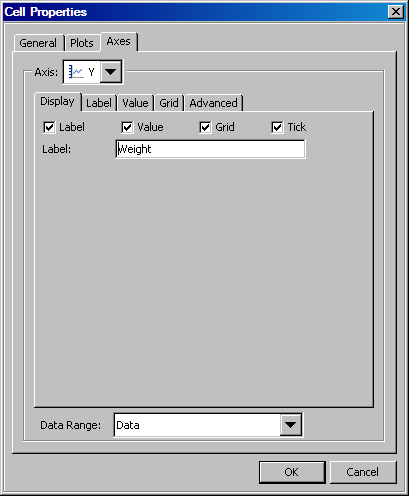
Axis Properties. The
Cell Properties dialog box appears and displays the
Axes tab. The axis that you clicked is selected for
editing.
Note: In paneled plots, the
Cell Properties dialog box does not open. Instead, an
Axis Properties dialog box appears and displays the
tabs shown here.
-
Make sure that the axis
that you want to change is selected in the
Axis list box.
-
On the
Display tab, select the check box for each item that you want to appear
on the axis.
-
To change the label,
specify the text that you want in the
Label text box.
If you do not want the
label to appear, you can delete all the text so that the text box
is blank. Effectively, this is the same as clearing the
Label check box. If you later want to restore the label,
select the
Label check box.
-
If the
Data
Range list box is available, then you can select a different
data range for the axis.
For more information, see About the Axis Data Range.
-
If the corresponding
check box has been selected, you can click one of the tabs to change
the label, value, grid, or advanced properties. Here are the types
of changes that you can make:
You can also specify
the color, font, size, and style (bold, italic) of the text from the
list boxes. If you change these properties, the settings that you
specify override any style that is applied to the graph.
You can modify the
style element that is applied to the axis values.
You can also specify
the color, font, size, and style (bold, italic) of the values from
the list boxes. If you change these properties, the settings that
you specify override any style that is applied to the graph.
You can modify the
color, the pattern (such as dotted or dashed), and the thickness of
the grid lines.
You can change the
axis type and specify a custom range for the axis. For a linear axis,
you can specify the tick sequence start, end, and increment values.
You can also reverse the axis.
For more information,
see About Advanced Axis Properties.
-