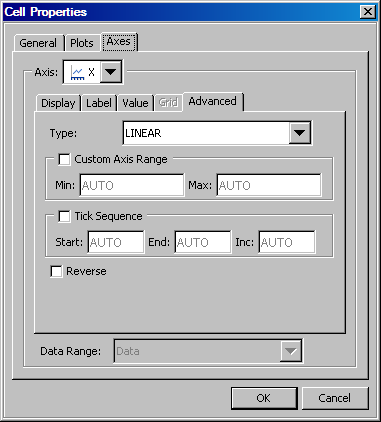
About Advanced Axis Properties
From the Axes tab of the Cell Properties dialog box, you can change the axis type and specify a custom range
for the axis. For a linear axis, you can specify the tick sequence
start, end, and increment values. You can also reverse the axis.
For instructions about
changing axis properties, see Change Axis Properties .
Within any given layout
in the graph, each plot axis is of a particular type. By default,
the axis type is linear or discrete. The data for discrete axes can
be character or numeric. Here are the available types:
-
Discrete: The axis contains independent data values rather than a range of numeric values. Each distinct value is represented by a tick mark. Discrete is the default axis type for character data. Some plots require a discrete axis. For example, bar charts use a discrete axis for the category variable.
-
Logarithmic: The axis contains a logarithmic range of values. The logarithmic axis type is not used as a default.You might want a logarithmic axis type depending on the nature of the data. For example, suppose that you plot your growth data with a linear axis and, based on the values, you suspect that the growth rate is exponential. If the data contains a very large range of values (orders of magnitude apart), you can display the values on a logarithmic scale. You can choose a logarithmic scale with base 10 or base 2.
You can change the
default axis type if the Type list box is
available. For example, if you create a scatter plot based on numeric
data, you can change the X axis from linear to discrete. A bar chart,
however, uses a discrete axis for the category (X) axis and a linear
axis for the response (Y) axis. Neither of these axis types can be
changed and, accordingly, the Type list box
is dimmed.
This feature applies
to axes of a linear or logarithmic type. By default, the axis range
is determined by the data. If the check box is enabled, you can adjust
the view of an axis by specifying minimum and maximum data values
to include in the display.
When you select the
check box, you can enter integer values, including negative values,
in the Min and Max boxes.
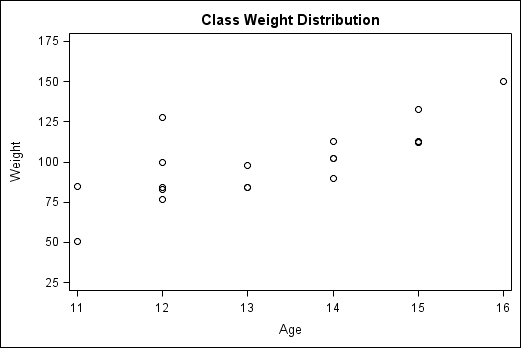
For example, the following
scatter plot shows the distribution of weight by age. By default,
the Y axis ranges from 60 to 140 pounds.

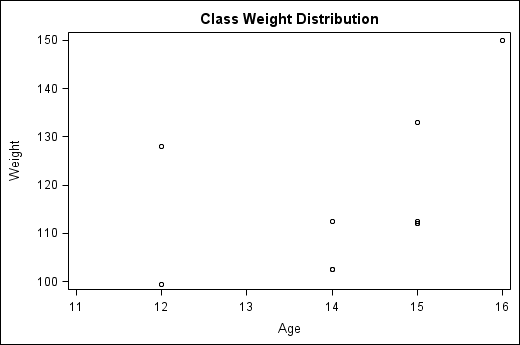
If you want to focus
on students above 100 pounds, you could enter 100 in the Min text box. This change yields the following plot:
The value specified
for the Min text box is greater than the
data minimum value. This setting acts like a “zoom in”
operation, reducing the range of values represented on the axis and
possibly excluding markers, lines, or fills that would normally appear.
You could further zoom in by setting the Max value to be less than the data maximum value.