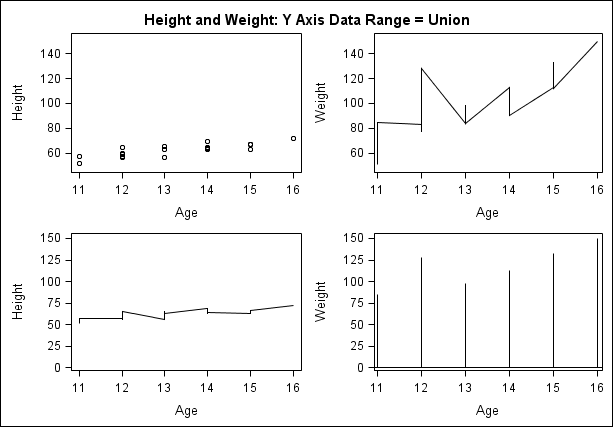
About the Axis Data Range
On the Axes tab of the Cell Properties dialog box,
the Data Range list box specifies how the
plot axes in multi-cell graphs are scaled. This option enables you
to control the uniformity of the axes across cells in multi-cell graphs
and classification panels. You can specify a uniform scale on the
X axes for the columns of a lattice or on the Y axes for the rows
of the lattice. This feature facilitates the visual comparison of
the data cells.
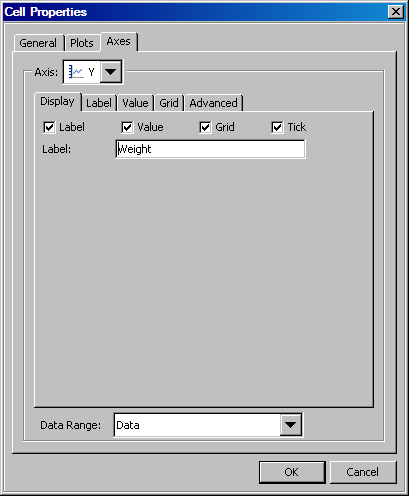
For instructions about
changing axis properties, see Change Axis Properties .
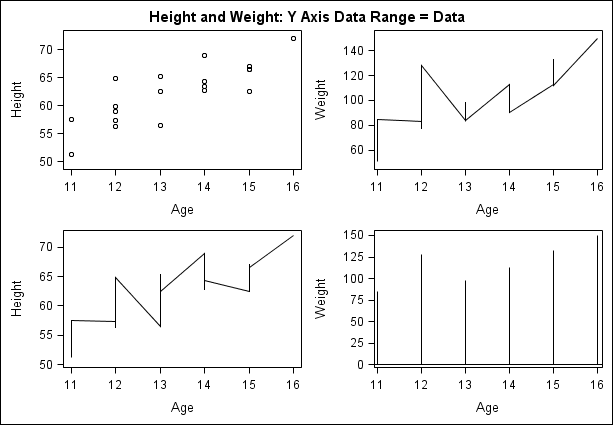
finds the minimum and
the maximum data points on a per-row or per-column basis, and specifies
this range on the appropriate axis for the row or column. This option
computes the axis range separately for each row (if modifying a Y
axis) or column (if modifying an X axis).