When you specify various
graph, legend, or title properties, you might have the option to select
a color. This option opens a Color list box.
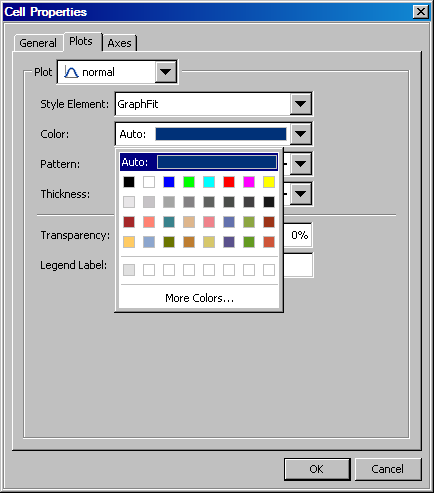
The Color list box provides
colors to choose from and the option to define your own color.
The Color list box contains
the following items:
restores the default
color. This option is useful when you have changed a color and want
to restore the original color.
The
Auto value indicates that the value is derived from a style element.
This value is not available for legend fill and outline.
The
Group value is used for plot properties. The
Group value indicates that the value is derived from a group variable
if one has been defined for the plot.
selects a predefined
color from the palette.
Row of recently used custom colors
selects a custom color.
This row is populated with colors that you choose after you click
the More Colors option.
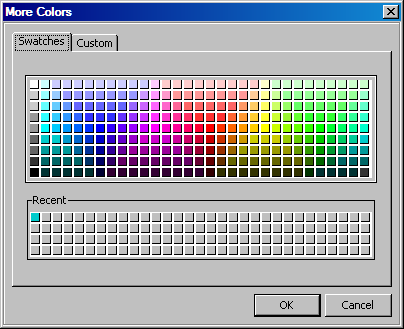
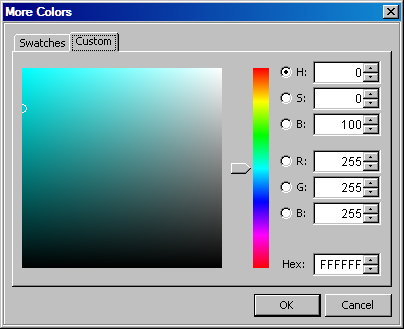
enables you to locate
a custom color. This option opens the More Colors dialog box, which contains two tabs:
|
|
In the Swatches tab, select a color from the expanded palette.
|
|
|
In the Custom tab, choose a color by dragging the slider and then picking a point
in the color preview box. Alternatively, you can specify the HSB,
RBG, or hexadecimal color value.
|


