About Styles and Style Elements
Overview of Styles and Style Elements
ODS styles control the
default color schemes and visual attributes for a graph. The style
contains information about the various fonts used for different textual
parts for the graph, such as titles, footnotes, and axis labels. The
style also contains information about colors, marker shapes and sizes,
line patterns, and so on. Styles are designed to create an aesthetic
and effective graph that conveys information clearly and without clutter.
SAS supplies a set of
predefined styles that can be used with the graphs. You can apply
different styles to your graph to achieve different effects. You can
also create your own custom styles. In ODS Graphics Designer, you
can create styles by using the interactive Graph Style Editor.
ODS styles consist of
style elements, and each style element has its own attributes. Within
a given style, the style elements give you more granular control of
a graph's visual elements.
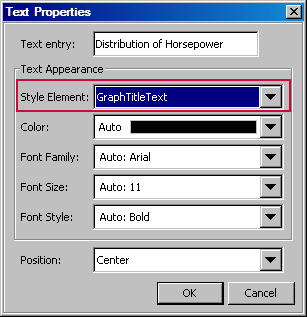
You can change the style
element that is assigned to a graph component in a particular graph.
For example, GraphTitleText is the default style element for a title.
To change the properties of a title, you can assign a different style
element. This feature enables you to obtain a different look for the
title without changing the applied style. For more information,
see Specifying Style Elements for Text Properties and Specifying Style Elements for Plot Properties.
You can override an
attribute of a style element. For example, if you want the title text
to be blue for your graphs, you can explicitly set the color to blue.
However, you must make this change for every graph. Instead, you can
change the definition of the style element itself and set its color
to blue. To do this, use the Graph Style Editor to make the change
and save your change as a custom style. Then you can apply the custom
style to your graphs, or make the custom style the default style for
all new graphs.
Main Tasks Related to Styles
-
Change the style that is applied to a graph. For instructions, see Change the Style That Is Applied to a Graph.
-
Change the style that is applied to new graphs by default. For instructions, see Setting Preferences.
-
Create a new style. For instructions, see Create a Custom Style. When you create a style, you can do the following:
-
Edit a style that you created. For instructions, see Modify a Custom Style.
-
Export a style to a SAS file. For instructions, see Export a Custom Style.
-
Delete a style that you created. For instructions, see Delete a Custom Style.
Note: If you customized styles
in the previous production release (9.2M3) of ODS Graphics Designer,
there is a one-time task that you must perform to migrate your custom
styles to the designer's new 9.3 location. For more information,
see Manual Tasks for Upgrading to SAS 9.3 ODS Graphics Designer.