About the Graph Style Editor
Introduction to the Graph Style Editor
The ODS Graphics Designer
includes an interactive Graph Style Editor that you can use to create
your own custom styles. You base custom styles on existing styles.
When you create custom styles, you change the attributes for various
style elements. The Graph Style Editor shows the association between
the style elements and the different parts of the graph.
Open the Graph Style Editor
As an alternative, open
a graph whose style you want to change, and select Format Style Edit Current Style. When opened this
way, the Graph Style Editor enables you to modify the style of the
graph and immediately apply the modified style to the graph. For more information,
see Modify and Apply the Current Style.
Style Edit Current Style. When opened this
way, the Graph Style Editor enables you to modify the style of the
graph and immediately apply the modified style to the graph. For more information,
see Modify and Apply the Current Style.
The Graph Style Editor's User Interface
Graph Style Editor
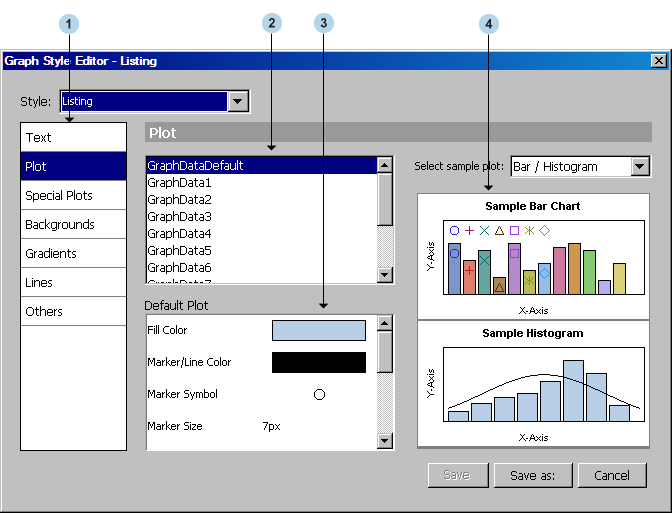
1Style element groups
2Style elements
3Style element attributes
4Sample graphs
visual representations
that show the relationships between various plot elements and the
style elements. You can click on a part of the graph, such as the
title, footnote, or marker, to see which style element controls a
particular plot element. For example, click on the title and the GraphTitleText
style element is selected. You can then change the style element's
attributes.