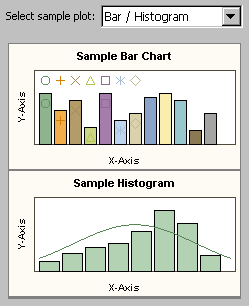
You can use the samples
in the right pane of the Graph Style Editor to help identify style
elements.
Samples in the Graph Style Editor
You can click a part
of the graph, such as the title, footnote, or marker, to see which
style element controls a particular plot element. For example:
-
To see the attributes for title
text, click the title of a sample plot. The GraphTitleText element
is selected. You can then change the element's attributes.
-
To see the attributes for fills,
markers, and lines, click a bin in the sample histogram. The GraphDataDefault
element is selected.
The fill attributes
are used for plots such as histograms and bar charts. The line attributes
are used for plots such as series or step. The marker attributes are
used for scatter plots.
-
To see the same attributes for
plots in which grouped variables are applied, click the different
colored bins in the sample bar chart.
-
To see other sample plots, select
a plot from the
Select sample plot list box.