Create a Custom Style

You cannot change the predefined SAS ODS styles. However, you can edit a SAS style, customize various style elements and attributes, and save your changes using a new style name.
To create a new custom style:
  1. Select Toolsthen selectStyle Editor. The Graph Style Editor appears.
    Graph Style Editor
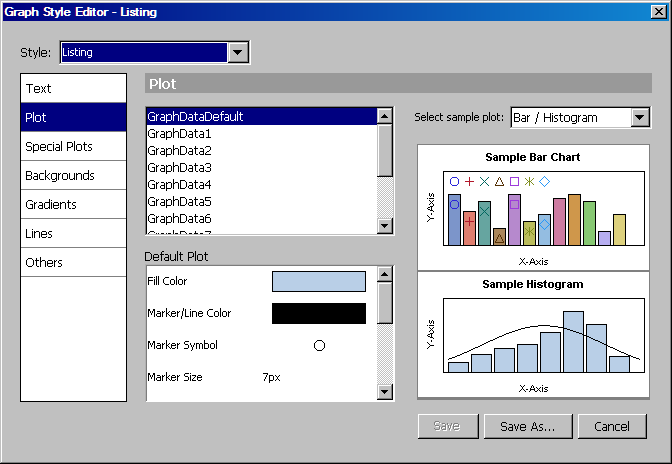
    For a description of the Graph Style Editor, see About the Graph Style Editor.
  2. From the Style list box, select the style that you want to use as the basis for the new style. When you select a style, the samples on the right side of the dialog box change to reflect the style.
  3. Select an element group in the left pane of the dialog box. Element groups include plots, backgrounds, gradients, lines, and other groupings. The Plot group is selected by default.
    The style elements for the selected group appear in the top middle pane.
    You can use the samples in the right pane to help identify style elements. For more information, see Use the Sample Graphs to Identify Style Elements. For descriptions of the style elements, including which graphics elements they control, see How the Style Elements Map to Parts of a Graph.
  4. Modify the style elements in the selected element group.
    1. Select a style element in the top middle pane. Attributes for the selected element appear in the bottom middle pane.
    2. To change an attribute, click the attribute. Then either select or specify the value that you want for the attribute.
      For example, when you click the Fill Color attribute, the attribute changes to a list box from which you can select a color.
      Fill Color attribute
      For some attributes, you enter one or more values. For example, to change the display options for an attribute, you enter the new display option or options.
      Display options attribute
      Note:
      • If you specify more than one value, leave a blank space between the values.
      • When you specify the value of an attribute, you must press ENTER before the new value takes effect.
    3. Continue changing attributes as appropriate to modify the style element.
    4. Repeat these steps to modify another style element and change its attributes.
    Note: Your style settings are ignored when the style is applied to a graph that has style element overrides. For example, if you have explicitly changed the marker color for a graph, then that explicit plot property setting overrides style settings for the graph.
  5. To make more changes, select a different element group. Then repeat the previous step to modify the style elements in the group.
  6. To save the new style, click Save as and provide a name for the style. If a custom style exists with the name that you provide, a message box asks whether you want to replace the style. If you click Yes, the custom style is overwritten.
    The Graph Style Editor remains open. To close the editor, click the Close icon Close Window icon in the top right corner of the editor.
After you have created a style, you can apply the style to your graphs. For instructions, see Change the Style That Is Applied to a Graph.
Note: You can also modify the current style of a graph and immediately apply the modified style to the graph. For more information, see Modify and Apply the Current Style.