Setting Preferences
Settings on the Graph Tab
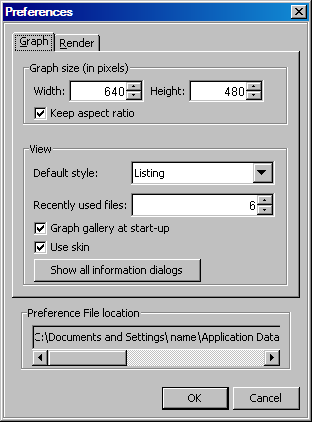
To change the size
that is used for graphs, click the up and down arrows in the Width and Height list boxes.
The width and height are measured in pixels. Clicking an arrow changes
the value by 10 pixels. Alternatively, you can enter values in the
boxes. By default, graphs are created with a width of 640 pixels and
a height of 480 pixels.
Tip
To determine the size in inches,
you can compute the value in pixels by using a default DPI of 100.
For example, if you want a width of five inches, then specify a width
of 500 pixels.
To size the graph proportionally,
make sure that the Keep aspect ratio check
box is selected. If you want to specify the width and height independently
without retaining the current aspect ratio, then clear the check box.
(This check box facilitates setting the width and the height check
boxes and is not itself a preference. If you clear the check box and
later reopen the Preferences dialog box,
the check box is still selected.)
By default, graph SGD
files use the ODS Listing destination style. You can select another
style from the list box, including a custom style that has been created
by using the designer.
Specify the number
of recently used files to display (when you select File Open Recent). You can use the up and down arrow or enter a value
in the box. The value that you specify must be greater than one.
Open Recent). You can use the up and down arrow or enter a value
in the box. The value that you specify must be greater than one.
Select or clear the
check box to show or hide the Graph Gallery when the designer is started.
This setting takes effect the next time you start the designer.
Select the check box
to show an embellished interface for the Elements pane and the Add an Element pop-up window. If you clear the check
box, then a simpler interface is used. The check box is selected by
default.
For displays that show
both the embellished and the simple interfaces, see About the Elements Pane.
Settings on the Rendering Tab
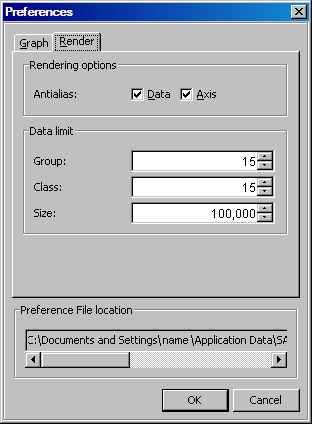
Select or clear the
check boxes to enable or disable anti-aliasing of data labels, axis
text, or both. When you select the Axis check
box, the setting applies to axis labels and tick values. The settings
have no effect on titles and footnotes.
When you enable anti-aliasing,
the designer produces smooth-edged type by partially filling the edge
pixels. The following letters show the difference between anti-aliasing
and not anti-aliasing.


Specify the maximum
number of values to display when a graph contains a group or a classification
variable. Select or enter the number for the group variable, the classification
variable, or both variables.
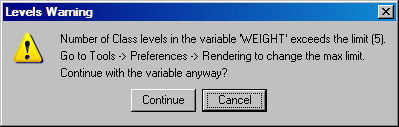
If a graph exceeds
the number that you specify, the designer issues a warning similar
to the one shown here. You can cancel the operation or continue and
override the preference setting.
You can also specify
the maximum number of observations in the data set to be rendered
by selecting or entering a different value in the Size list box. If a data set exceeds the specified size, a warning message
is displayed. You can then cancel the operation or continue and override
the preference setting. The minimum value that you can enter is 1,000.