About the Elements Pane
Overview of the Elements Pane
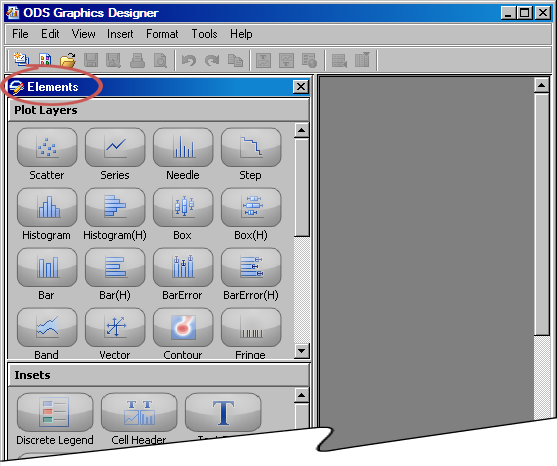
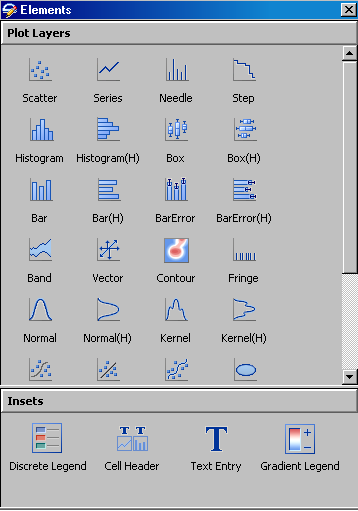
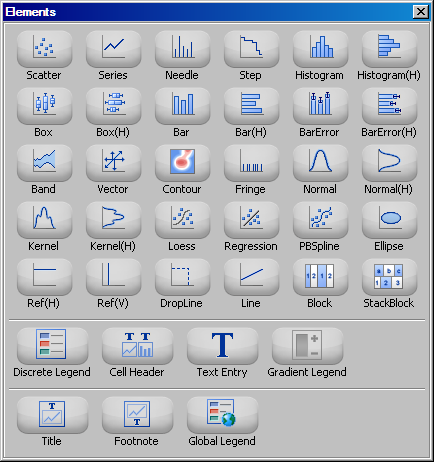
The Elements pane contains the following panels:
-
The Plot Layers panel contains plots that you can click and drag to a graph cell. For a description of this panel, see About the Plot Layers Panel.
-
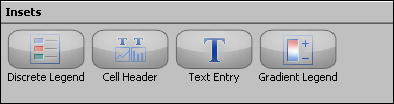
The Insets panel contains graphics elements that you can click and drag to a graph cell. For a description of this panel, see About the Insets Panel.
The elements on these
panels are available only when a graph is open. To insert an element
into a graph, click and drag the element to the graph.
Note: You can also insert an element
by using a context menu. For more information, see Use the Add an Element Pop-up Window.
Use the Add an Element Pop-up Window
About the Plot Layers Panel
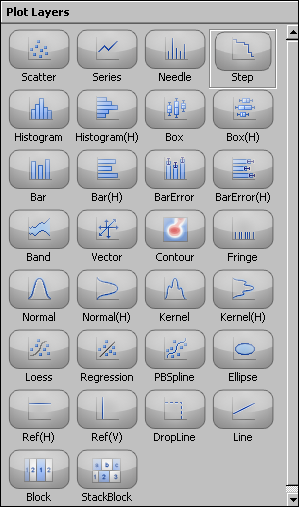
The Plot
Layers panel contains plots that you can click and drag
to a graph cell. The panel contains a number of different plot types
that can be used to design many types of graphs. All of the elements
in this panel are plots. Here are the general types of plots:
You can add multiple
plots to a graph cell as long as the data types are compatible. For more information,
see Compatible Plot Types. These plots are layered, or overlaid, in the
cell.
About the Insets Panel
Change the Appearance of the Elements Pane
You can change the appearance
of the Elements pane by setting a preference so that a simpler interface
is used. For
instructions, see Setting Preferences.