About the Graph Gallery
Overview of the Graph Gallery
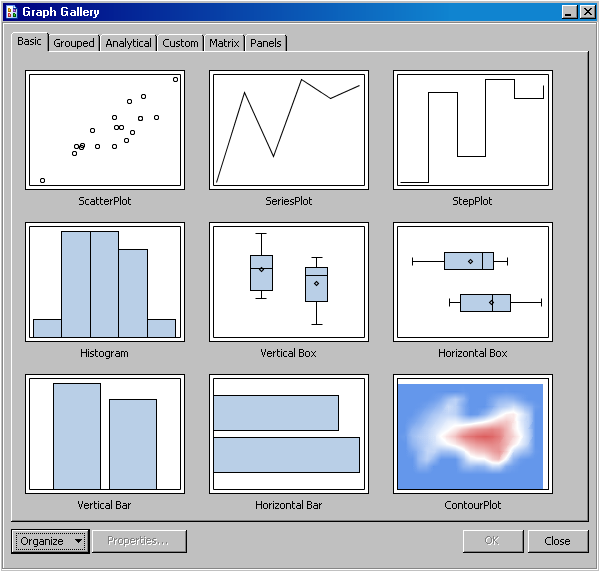
The ODS Graphics Designer
provides a gallery of predefined, commonly used plots. The Graph Gallery
is organized into groups of graphs. Each group is represented as a
tab in the gallery. The following display shows the default view of
the graphs that are on the Basic tab.
You can choose one of
these predefined graphs as the basis for your graph. You can then
customize your graph by adding titles, footnotes, legends, additional
plots, and other items.
In addition to the predefined
graphs, you can add your own custom graphs to the Graph Gallery. For instructions, see Add a Graph to the Graph Gallery.

Description of the Tabs in the Graph Gallery
The Graph Gallery organizes
graphs into tabs. For example, the Grouped tab contains plots for data that has been grouped by a variable.
For graphs that are
created from the Graph Gallery, placeholder data is assigned to the
plot or plots in the graph. When you create your graph, you can change
the data as appropriate.
Note: Before changing the data,
you should ensure that your replacement data has been properly preprocessed
for the plots in the gallery. Some plots require particular types
of data. For example, in the Pareto graph on the Analytical tab, the series plot requires a variable that calculates a cumulative
percent.
You can add your own
custom groups to the gallery. For more information,
see Managing Graphs in the Graph Gallery.