After you have designed
a graph, you can add that graph to the Graph Gallery for future reuse.
To add a graph to the
Graph Gallery:
-
Select the graph that
you want to add.
-
Select
File Save in Graph Gallery
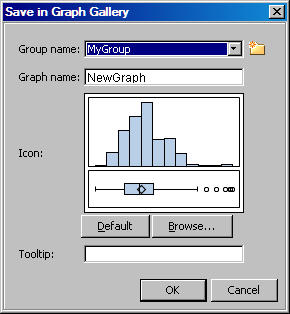
. The
Save in Graph Gallery dialog box appears.
-
From the
Group name list box, select the name of the group into
which you want to add the graph. Each group corresponds to a tab in
the gallery.
The
Group
name list box contains the names of groups that have
been created at your site. The list box does not contain the names
of the default groups.
To create a new group,
click the New icon

. In the
New Group dialog
box, enter the name that you want for the group, and then click
OK.
-
In the
Graph
name text box, enter the name that you want displayed
in the gallery. If a graph exists with the name that you provide,
you are prompted to overwrite the existing graph. The default name
is NewGraph.
-
The
Icon field shows a small icon that ODS Graphics Designer creates to represent
the graph being added to the gallery. However, if you want to use
a custom icon to identify the graph, click
Browse and locate the image that you want to use. The image can be in BMP,
GIF, JPEG, or PNG format. Regardless of its original size, the image
is scaled to a fixed size in the gallery.
You can revert to the
automatically created icon by clicking the
Default button. Automatically generated icons do not show the axis labels,
titles, footnotes, and legends; they show only the main part of the
graph.
-
In the
Tooltip text box, enter a short description of the graph. This description
is displayed as a tooltip when the cursor hovers over the graph's
icon. If you do not enter a tooltip description, the graph name becomes
the tooltip by default.
-
Click
OK. The graph is added to the Graph Gallery.