You can change the name,
icon, and tooltip for any of the following types of graphs:
-
graphs that you have added to the
Graph Gallery
-
graphs that you have copied to
a custom group in the Graph Gallery
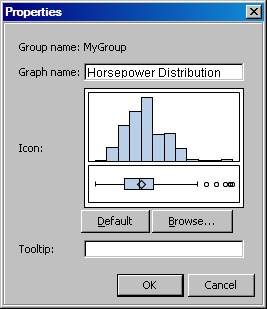
To change the name,
icon, and tooltip for any of these graphs:
-
In the Graph Gallery,
select the graph that you want to modify.
-
Right-click the graph
and select
Properties, or click
Properties at the bottom of the gallery. The Properties
dialog box appears.
-
In the
Graph
name text box, enter the name that you want to display
next to the graph icon in the gallery.
-
To change the icon,
click
Browse and locate the image that you
want to use to represent the graph. The image can be in BMP, GIF,
JPEG, or PNG format. Regardless of its original size, the image is
scaled to a fixed size in the gallery.
You can revert to the
automatically created icon by clicking the
Default button. Automatically generated icons do not show the axis labels,
titles, footnotes, and legends; they show only the main part of the
graph.
-
In the
Tooltip text box, enter a short description of the graph. This description
is displayed as a tooltip when the cursor hovers over the graph's
icon. If you do not enter a tooltip description, the graph name becomes
the tooltip by default.
-