GCONTOUR Procedure

Example 3: Specifying Contour Levels
| Features: |
AXIS statement option: ORDER= |
| Data set: | POLLEN |
| Sample library member: | GCTNLVEL |
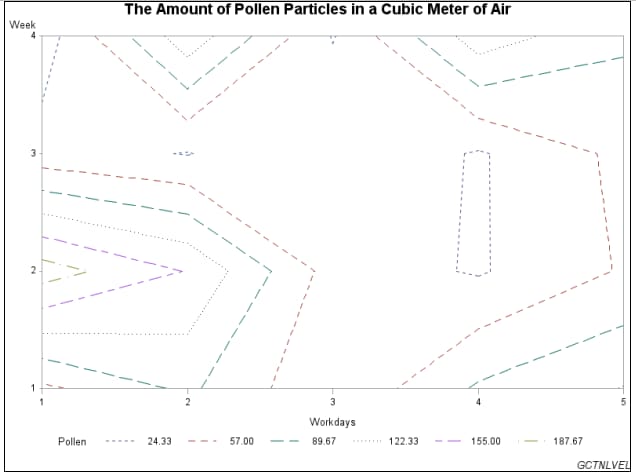
This contour plot shows
the amount of pollen in the air for five work days (x–axis)
in a four-week series (y-axis).
The PLOT statement uses the NLEVELS= option to specify the number
of contour levels to plot for the z variable.
The NLEVELS= option enables you to specify up to 100 levels in your
plot.
Program
goptions reset=all border;
data pollen;
input Week Workdays Pollen @@;
datalines;
1 1 50 1 2 96 1 3 28 1 4 94 1 5 124 2 1 204 2 2 153 2 3 43 2 4 21 2 5 60
3 1 37 3 2 23 3 3 57 3 4 21 3 5 65 4 1 8 4 2 144 4 3 22 4 4 141 4 5 95
;
run;
title1 "The Amount of Pollen Particles in a Cubic Meter of Air";
footnote1 j=r "GCTNLVEL";
axis1 order=(1 to 4 by 1);
proc gcontour data=pollen;
    plot week*workdays=pollen/
       hminor=0
       llevels= 2 20 21 33 25 41
       name="GCTNLVEL"
       nlevels=6
       vaxis=axis1
       vminor=0;
 run;
 quit;
Program Description
data pollen;
input Week Workdays Pollen @@;
datalines;
1 1 50 1 2 96 1 3 28 1 4 94 1 5 124 2 1 204 2 2 153 2 3 43 2 4 21 2 5 60
3 1 37 3 2 23 3 3 57 3 4 21 3 5 65 4 1 8 4 2 144 4 3 22 4 4 141 4 5 95
;
run;
Define an axis statement for the vertical axis. Define an AXIS statement to order and increment
the axis values.
Generate the contour plot. HMINOR=0
sets the number of minor tick marks on the horizontal axis to 0. The
LLEVELS= option lists a line type for each contour line. The number
of line types listed correspond to the number of contour levels specified
in the NLEVELS= option. NLEVELS=6 specifies the number of levels to
compute for z. The NAME= option
specifies the name of the catalog entry for the plot. The VAXIS= option
assigns the AXIS1 statement to the vertical axis. VMINOR=0 sets the
number of minor tick marks on the vertical axis to 0.