GCONTOUR Procedure

Overview: GCONTOUR Procedure
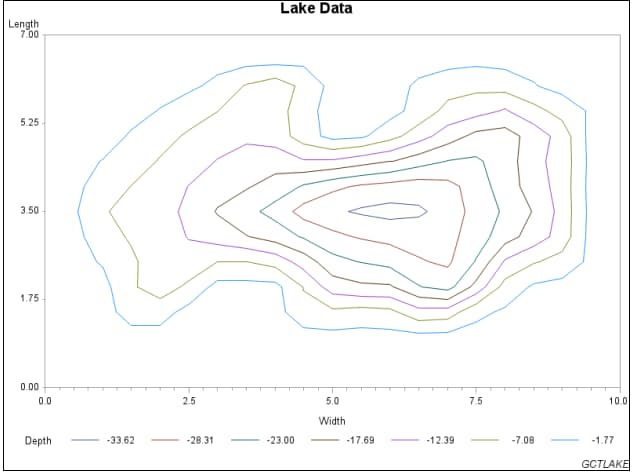
The GCONTOUR procedure
enables you to generate two-dimensional plots representing three-dimensional
relationships. For example, the
following Simple Contour Plot displays various depths of a lake.
The dimensions of the lake are plotted on the x and y axes.
The z variable is plotted as
the third dimension, and is displayed as uniquely colored contour
lines.