GCONTOUR Procedure

Example 2: Labeling Contour Lines, Modifying the Horizontal Axis, Modifying the Legend
| Features: |
|
| Other features: |
|
| Data set: | SASHELP.LAKE |
| Sample library member: | GCTLABEL |
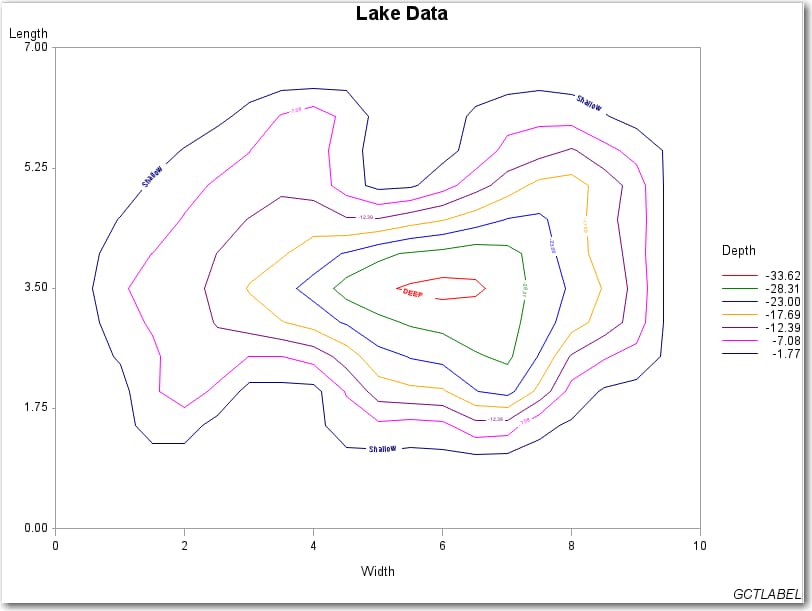
This example modifies Simple Contour Plot to label contour
levels with the AUTOLABEL option. The SYMBOL
statement used with the AUTOLABEL option enables you to customize
the attributes of the contour lines and labels.
In this example, SYMBOL1
and SYMBOL7 assign text labels, text fonts, text height, and text
and line color for the first and seventh contour level lines. SYMBOL2–SYMBOL6
define the text height, and the text and line color for contour level
lines 2–6.
Program
goptions reset=all border;
title1 "Lake Data";
footnote1 j=r "GCTLABEL";
symbol1 value="DEEP"
        color=red
        font="Arial Rounded MT Bold"
        height=.6;
symbol2 color=green
        height=.45;
symbol3 color=blue
        height=.45;
symbol4 color=orange
        height=.45;
symbol5 color=purple
        height=.45;
symbol6 color=magenta
        height=.45;
symbol7 value="Shallow"
        color=navy
        font="Arial Rounded MT Bold"
        height=.7;
legend1 position=(right middle)
        label=(position=top)
        across=1;
axis1 order=(0 to 10 by 2) minor=none;
proc gcontour data=sashelp.lake;
   plot length*width=depth/
       autolabel=(check=none)
      haxis=axis1
      legend=legend1
      name="GCTLABEL";
run;
quit;
Program Description
Define symbol statements. SYMBOL
statements define the characteristics of the lines and labels for
the contour lines. Each SYMBOL statement is associated to an individual
contour level starting with the first level displayed in the LEGEND.
symbol1 value="DEEP"
        color=red
        font="Arial Rounded MT Bold"
        height=.6;
symbol2 color=green
        height=.45;
symbol3 color=blue
        height=.45;
symbol4 color=orange
        height=.45;
symbol5 color=purple
        height=.45;
symbol6 color=magenta
        height=.45;
symbol7 value="Shallow"
        color=navy
        font="Arial Rounded MT Bold"
        height=.7;
Define legend characteristics. The
LEGEND statement controls the location and appearance of the legend.
The POSITION= option specifies the position of the legend relative
to the plot; RIGHT specifies the horizontal position; MIDDLE specifies
the vertical position. The LABEL= option modifies the legend label;
POSITION=TOP places the legend label relative to the legend entries;
the ACROSS= option defines the number of columns in the legend.
Define axis characteristics. The
ORDER= option specifies the order in which the data values appear
on the axis; the ORDER= values are displayed as the major tick marks
values; MINOR=NONE suppresses all minor tick marks.
Generate the contour plot. The
AUTOLABEL= option labels the contour lines; (CHECK=NONE) suppresses
contour label collision checking, and might lessen the time needed
to compute the plot. HAXIS=AXIS1 assigns the AXIS1 definition to the
horizontal axis. LEGEND=LEGEND1 assigns the LEGEND1 definition to
the LEGEND. The NAME= option specifies the name of the catalog entry
for the graph.