G3GRID Procedure
Example 4: Spline Interpolation
| Features: |
GRID statement options AXIS1=, AXIS2=, and SPLINE
|
| Data set: |
NUMS |
| Sample library member: |
GTGSPLIN |
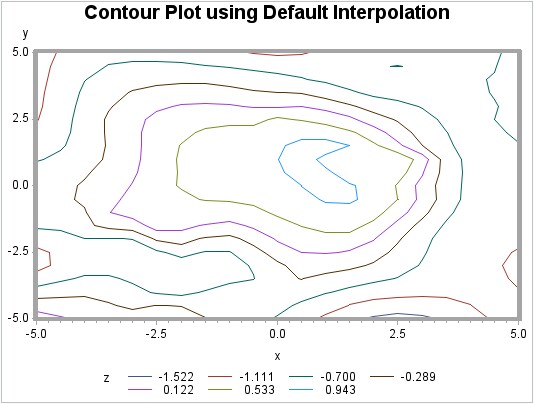
This example demonstrates
the default interpolation method when used by the GCONTOUR procedure
to generate a contour plot from the resulting output data set.
Contour Plot Using Default Interpolation (gtgsplin)
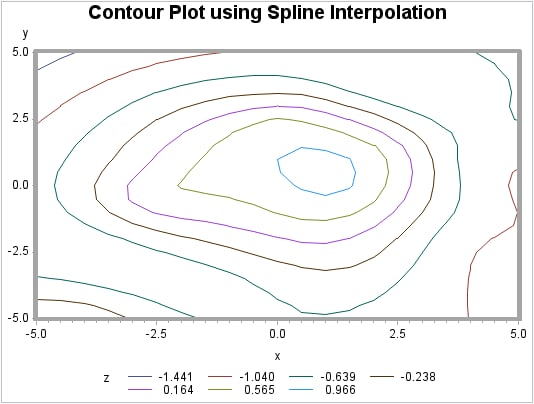
The second plot, demonstrates
the spline interpolation method when used by the GCONTOUR procedure
to generate a contour plot from the resulting output data set.
Contour Plot Using Spline Interpolation (gtgsplin)
Program
goptions reset=all border;
title "Contour Plot using Default
Interpolation";
axis1 width=3;
proc g3grid data=nums out=numdef;
   grid y*x=z /
      axis1=-5 to 5 by .5
      axis2=-5 to 5 by .5;
   run;
proc gcontour data=numdef;
   plot y*x=z /
      haxis=axis1
      vaxis=axis1;
   run;
quit;
title "Contour Plot using Spline
Interpolation";
proc g3grid data=nums out=numspl;
   grid y*x=z / spline
                axis1=-5 to 5 by .5
                axis2=-5 to 5 by .5;
run;
proc gcontour
data=numspl;
   plot y*x=z /
      haxis=axis1
      vaxis=axis1;
   run;
quit;
Program Description
Set the graphics environment.
goptions reset=all border;
Define the title for the plot.
title "Contour Plot using Default
Interpolation";
Define the axis characteristics.
Process data with PROC G3GRID.
proc g3grid data=nums out=numdef;
   grid y*x=z /
      axis1=-5 to 5 by .5
      axis2=-5 to 5 by .5;
   run;
Generate the contour after default interpolation.
proc gcontour data=numdef;
   plot y*x=z /
      haxis=axis1
      vaxis=axis1;
   run;
quit;
Define the title for the plot.
title "Contour Plot using Spline
Interpolation";
Process data with PROC G3GRID. The SPLINE option specifies the bivariate spline method for the
interpolation.
proc g3grid data=nums out=numspl;
   grid y*x=z / spline
                axis1=-5 to 5 by .5
                axis2=-5 to 5 by .5;
run;
Generate the contour plot using the spline interpolation.
proc gcontour
data=numspl;
   plot y*x=z /
      haxis=axis1
      vaxis=axis1;
   run;
quit;
Copyright © SAS Institute Inc. All rights reserved.