G3GRID Procedure

Overview: G3GRID Procedure
The G3GRID procedure
processes an existing SAS data set to create a data set that the G3D
procedure or the GCONTOUR procedure can use to produce a three-dimensional
surface plot or a contour plot. The procedure creates a data set whose
horizontal X-Y variable values form a complete grid, and it interpolates
the values of the vertical Z variable for each point on the X-Y plane.
The G3GRID procedure
does not produce graphics output. PROC G3GRID produces an output data
set that you can use as the input data set for PROC G3D or PROC GCONTOUR.
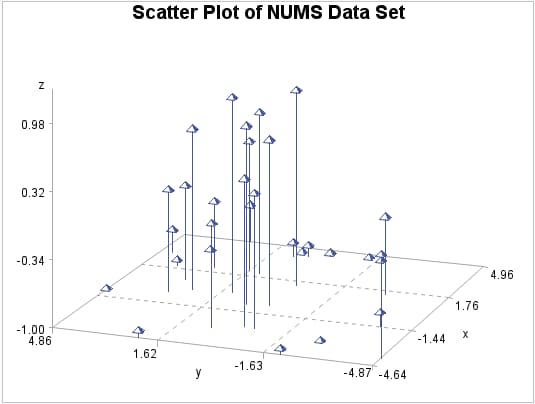
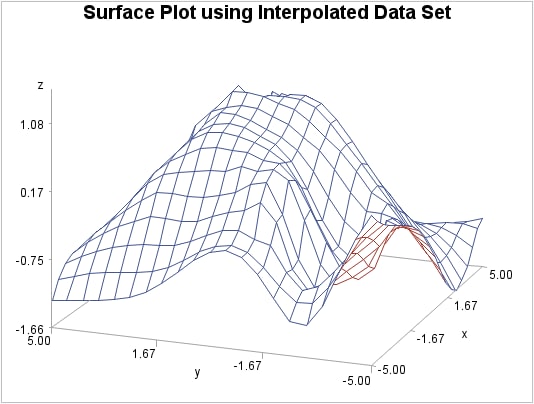
Scatter Plot of Data Set before G3GRID Processing (gtgdefin), and Surface Plot of Data Set after G3GRID Processing (gtdefin) illustrate
the effect of the G3GRID procedure on data.
This figure shows a
collection of data points, where z=f(x,y). These points are randomly
distributed, and cannot be displayed with a G3D surface plot, although
they can be displayed with a scatter plot.