GFONT Procedure

Example 2: Creating Figures for a Symbol Font
| Features: |
|
| Other features: |
LIBNAME statement |
| Sample library member: | GFOCRFIG |
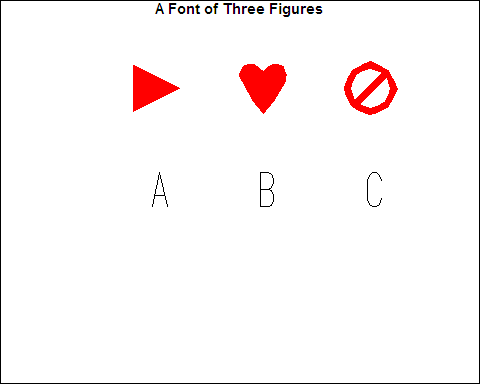
Create three simple
figures for a symbol font. Each figure is laid out on a grid that
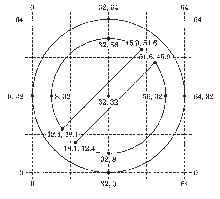
is 64 font units square. The third figure is a circle with a slash
through it. Diagram of Circle with Slash Figure shows the figure
and some of its coordinate points laid out on a grid.
Program
LIBNAME gfont0 "SAS-data-library";
goptions reset=all border;
data figures;
   input char $ ptype $ x y segment lp $;
   datalines;
A    W    0    64   0    P  /* triangle pointing right */
A    V    4     4   1    P
A    V   60    32   1    P
A    V    4    60   1    P
A    V    4     4   1    P
B    W    0    64   0    P  /* heart */
B    V   32     2   1    P
B    V   44    17   1    P
B    V   58    40   1    P
B    C   46    47   1    P
B    V   56    58   1    P
B    C   46    47   1    P
B    V   32    52   1    P
B    C   18    47   1    P
B    V    8    58   1    P
B    C   18    47   1    P
B    V    6    40   1    P
B    V   20    17   1    P
B    V   32     2   1    P
C    W    0    64   0    P  /* circle with slash */
C    V   32    64   1    P
C    C   32    32   1    P
C    V   64    32   1    P
C    C   32    32   1    P
C    V   32     0   1    P
C    C   32    32   1    P
C    V    0    32   1    P
C    C   32    32   1    P
C    V   32    64   1    P
C    V    .     .   1    P
C    V   12.4  18.1 1    P
C    C   32    32   1    P
C    V    8    32   1    P
C    C   32    32   1    P
C    V   32    56   1    P
C    C   32    32   1    P
C    V   45.9  51.6 1    P
C    V    .     .   1    P
C    V   51.6  45.9 1    P
C    C   32    32   1    P
C    V   56    32   1    P
C    C   32    32   1    P
C    V   32     8   1    P
C    C   32    32   1    P
C    V   18.1  12.4 1    P
;
title "A Font of Three Figures";
proc gfont data=figures
           name=figures
           filled
           height=.75in
           ctext=red
           showroman
           romht=.5in
           resol=2;
run;
quit;
Program Description
Assign the librefs and set the graphics environment. The LIBNAME statement associates the libref GFONT0
with the SAS library in which the font catalog is stored.
Create the font data set FIGURES for a triangle, a heart,
and a circle with slash. The first figure,
a right-pointing triangle that is assigned the character code A, is
a polygon drawn with three straight lines.
data figures;
   input char $ ptype $ x y segment lp $;
   datalines;
A    W    0    64   0    P  /* triangle pointing right */
A    V    4     4   1    P
A    V   60    32   1    P
A    V    4    60   1    P
A    V    4     4   1    P
The second figure, a heart that is assigned the character
code B, uses the PTYPE variable combination V-C-V to draw the arcs
that make up the top of the heart. Each
side requires two arcs. Because the arcs are continuous, the observation
that marks the end of one arc is also the beginning of the next arc.
The heart drawing begins at the bottom point and continues counterclockwise.
B    W    0    64   0    P  /* heart */
B    V   32     2   1    P
B    V   44    17   1    P
B    V   58    40   1    P
B    C   46    47   1    P
B    V   56    58   1    P
B    C   46    47   1    P
B    V   32    52   1    P
B    C   18    47   1    P
B    V    8    58   1    P
B    C   18    47   1    P
B    V    6    40   1    P
B    V   20    17   1    P
B    V   32     2   1    P
The third figure, a circle with a slash through it, assigned
the character code C, consists of three polygons: a circle and two
empty arcs. An observation with missing
values separates the observations defining each of the three polygons.
The outer circle is defined by the first group of observations. The
empty arcs are drawn with three continuous arcs using the PTYPE variable
pattern V-C-V-C-V-C-V. The straight line that closes the arc is drawn
automatically by the GFONT procedure in order to complete the polygon.
Because all the polygons are part of one character, the continuous
space that they define is filled.
C    W    0    64   0    P  /* circle with slash */
C    V   32    64   1    P
C    C   32    32   1    P
C    V   64    32   1    P
C    C   32    32   1    P
C    V   32     0   1    P
C    C   32    32   1    P
C    V    0    32   1    P
C    C   32    32   1    P
C    V   32    64   1    P
C    V    .     .   1    P
C    V   12.4  18.1 1    P
C    C   32    32   1    P
C    V    8    32   1    P
C    C   32    32   1    P
C    V   32    56   1    P
C    C   32    32   1    P
C    V   45.9  51.6 1    P
C    V    .     .   1    P
C    V   51.6  45.9 1    P
C    C   32    32   1    P
C    V   56    32   1    P
C    C   32    32   1    P
C    V   32     8   1    P
C    C   32    32   1    P
C    V   18.1  12.4 1    P
;