GRADAR Procedure

Example 7: Creating a Windrose Chart
| Features: |
|
| Sample library member: | GRRWNDRS |
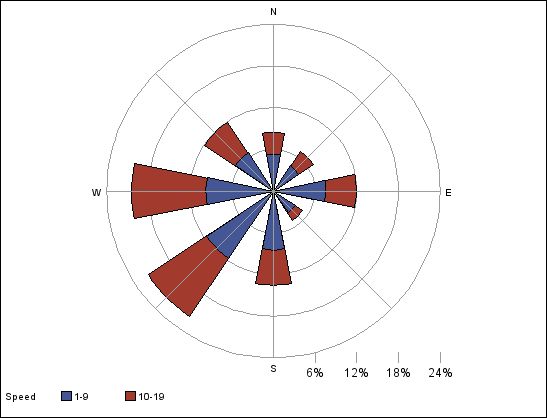
The windrose chart displays
wind direction and speed over a period of time at a specific location.
The segments represent the percentage of time that the wind blew
from each direction.
goptions reset=all border;

data wind;
   input Direction $ Speed $ Percent @@;
datalines;
N    1-9  1.7 N  10-19 1.0 NE   1-9  1.4
NE  10-19  .8 E    1-9 2.4 E   10-19 1.4
SE   1-9  1.2 SE 10-19  .4 S    1-9  2.7
S   10-19 1.6 SW   1-9 3.7 SW  10-19 3.2
W    1-9  3.1 W  10-19 3.4 NW   1-9  2.1
NW  10-19 1.7
run;

proc gradar data=wind;
    chart direction / sumvar=percent
    windrose
    speed=speed
    noframe;
run;
quit;