GRADAR Procedure

Example 2: Overlaying Radar Charts
| Features: |
|
| Sample library member: | GRROVER |
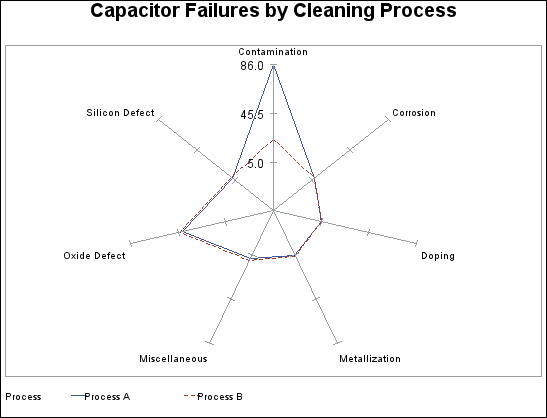
The most typical way that radar charts are displayed
is to overlay the charts on top of each other. To produce an overlay
chart, use the OVERLAY= option in the CHART statement. On the OVERLAY=
option, specify the classification variable whose values determine
the charts to be overlaid. This example shows two blocks of code.
For overlay charts with multiple stars, the lines for the stars are
rotated through different line styles and colors so that the different
stars can be easily seen.