GRADAR Procedure

Example 1: Producing a Basic Radar Chart
| Features: |
CHART statement options: FREQ= |
| Sample library member: | GRRBASIC |
During the manufacture
of a metal-oxide semiconductor (MOS) capacitor, different cleaning
processes were used by two manufacturing systems that were operating
in parallel. Process A used a standard cleaning solution, while Process
B used a different cleaning mixture that contained less particulate
matter. For five consecutive days the causes of failure with each
process were observed, recorded, and saved in the SAS data set called
FAILURE.
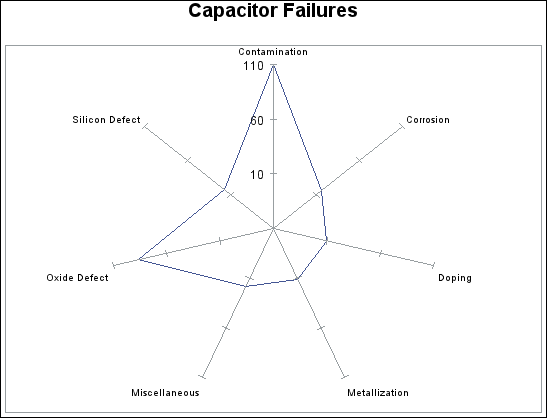
In a radar chart, the vertices are determined by the
levels of a single variable, which is specified in the CHART statement.
In this example, the variable CAUSE is specified as the chart variable.
The spokes in the chart start at the twelve o'clock position and go
in a clockwise order. The output shows that Contamination and Oxide
Defects are the most frequently occurring problems.