GSLIDE Procedure

Example 2: Displaying Annotate Graphics
| Features: |
PROC GSLIDE option ANNOTATE= |
| Other features: |
Annotate data set |
| Sample library member: | GSLANNOT |
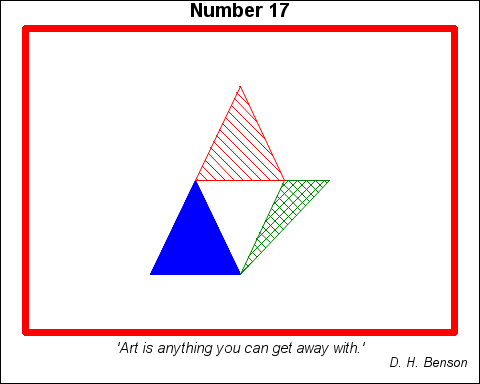
In this example, the
GSLIDE procedure displays Annotate graphics along with current TITLE
and FOOTNOTE definitions. See Using Annotate Data Sets for information on creating Annotate data sets.
Program
goptions reset=all border;
data art;
   length function color style $ 8;
   input function $ x y color $ style $;
   xsys="5"; ysys="5";
   datalines;
poly      30  20  blue    solid
polycont  50  20  .       .
polycont  40  50  .       .
poly      50  20  green   x1
polycont  70  50  .       .
polycont  60  50  .       .
poly      40  50  red     l1
polycont  60  50  .       .
polycont  50  80  .       .
;
title "Number 17";
footnote1 h=2 "'Art is anything you can get away with.'";
footnote2 j=r "D. H. Benson   ";
footnote4 angle=90;
footnote5  angle=-90;
proc gslide annotate=art
            border
            wframe=6
            cframe=red;
run;
quit;
Program Description
data art;
   length function color style $ 8;
   input function $ x y color $ style $;
   xsys="5"; ysys="5";
   datalines;
poly      30  20  blue    solid
polycont  50  20  .       .
polycont  40  50  .       .
poly      50  20  green   x1
polycont  70  50  .       .
polycont  60  50  .       .
poly      40  50  red     l1
polycont  60  50  .       .
polycont  50  80  .       .
;
Define the title and footnotes displayed by the procedure. FOOTNOTE statements 4 and 5 have no text and are
angled vertically to add space on the left and right sides between
the border of the output and the frame that surrounds the procedure
output area.
title "Number 17";
footnote1 h=2 "'Art is anything you can get away with.'";
footnote2 j=r "D. H. Benson   ";
footnote4 angle=90;
footnote5  angle=-90;