The TIMESERIES Procedure
- Overview
- Getting Started
-
Syntax

-
DetailsAccumulationMissing Value InterpretationTime Series TransformationTime Series DifferencingDescriptive StatisticsSeasonal DecompositionCorrelation AnalysisCross-Correlation AnalysisSpectral Density AnalysisSingular Spectrum AnalysisData Set OutputOUT= Data SetOUTCORR= Data SetOUTCROSSCORR= Data SetOUTDECOMP= Data SetOUTFREQ= Data SetOUTPROCINFO= Data SetOUTSEASON= Data SetOUTSPECTRA= Data SetOUTSSA= Data SetOUTSUM= Data SetOUTTREND= Data Set_STATUS_ Variable ValuesPrinted OutputODS Table NamesODS Graphics Names
-
Examples
- References
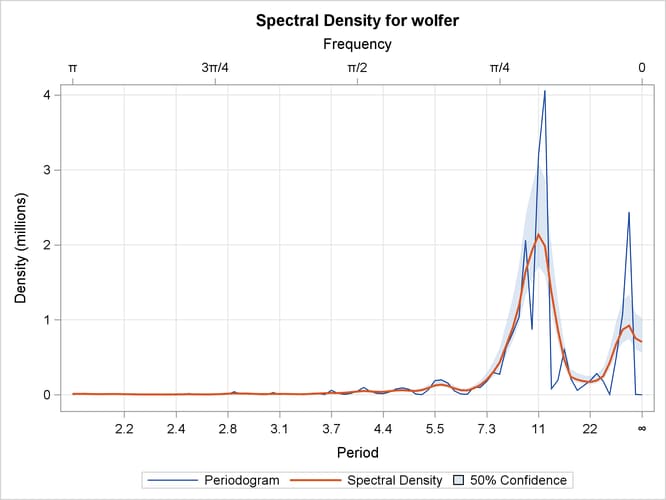
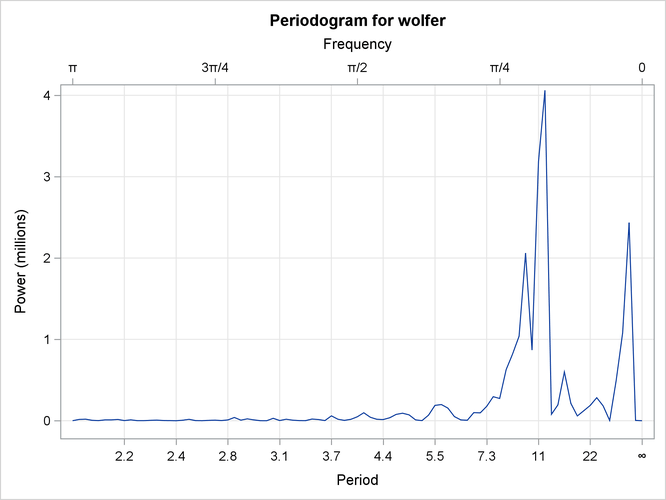
Example 39.4 Illustration of Spectral Analysis
This example illustrates the use of spectral analysis.
The following statements perform a spectral analysis on the SUNSPOT dataset. The periodogram is displayed as a function of the period and frequency in Output 39.4.1. The estimated spectral density together with its 50% confidence limits are displayed in Output 39.4.2.
title "Wolfer's Sunspot Data";

proc timeseries data=sunspot plot=(series periodogram spectrum);
   var wolfer;
   id year interval=year;
   spectra freq period p s / adjmean bart c=1.5 expon=0.2;
run;
Output 39.4.1: Periodogram
Output 39.4.2: Spectral Density Plot