The TIMESERIES Procedure
- Overview
- Getting Started
-
Syntax

-
DetailsAccumulationMissing Value InterpretationTime Series TransformationTime Series DifferencingDescriptive StatisticsSeasonal DecompositionCorrelation AnalysisCross-Correlation AnalysisSpectral Density AnalysisSingular Spectrum AnalysisData Set OutputOUT= Data SetOUTCORR= Data SetOUTCROSSCORR= Data SetOUTDECOMP= Data SetOUTFREQ= Data SetOUTPROCINFO= Data SetOUTSEASON= Data SetOUTSPECTRA= Data SetOUTSSA= Data SetOUTSUM= Data SetOUTTREND= Data Set_STATUS_ Variable ValuesPrinted OutputODS Table NamesODS Graphics Names
-
Examples
- References
Example 39.3 Illustration of ODS Graphics
This example illustrates the use of ODS graphics.
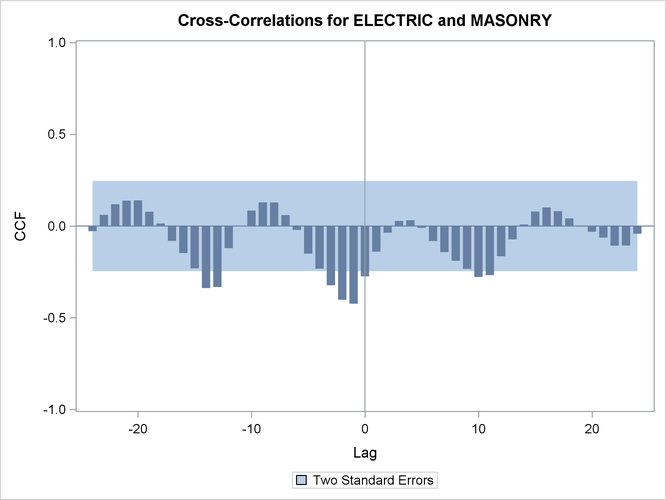
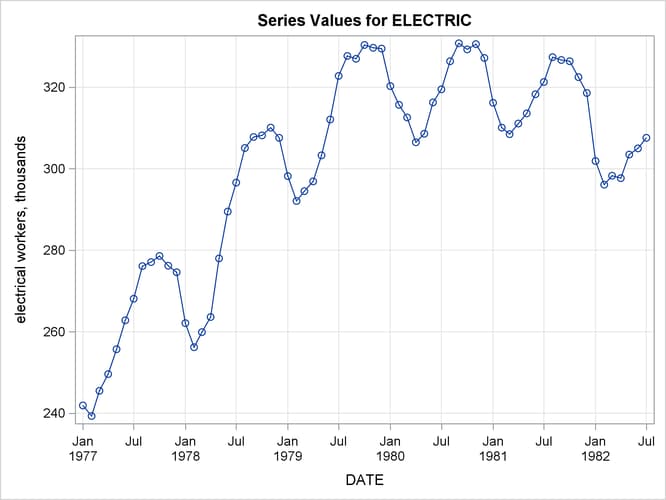
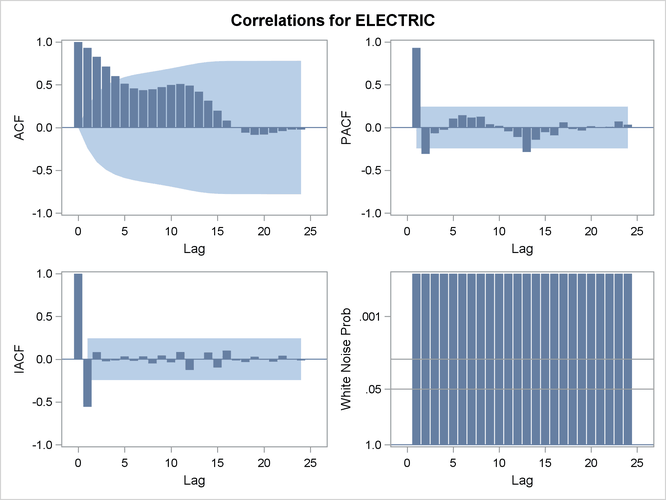
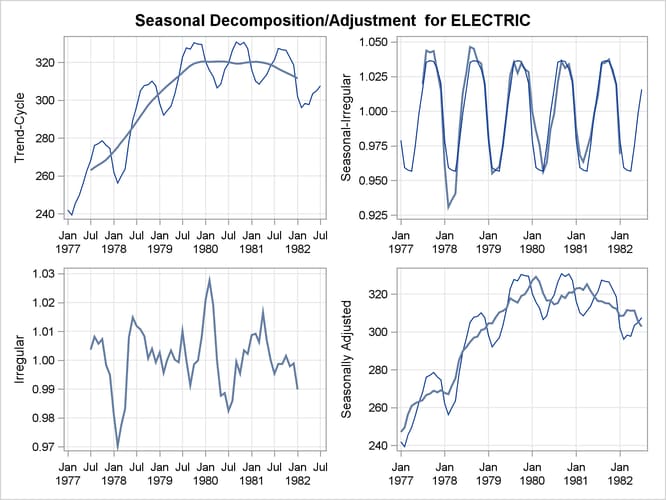
The following statements use the SASHELP.WORKERS data set to study the time series of electrical workers and its interaction with the simply differenced series of masonry
workers. The series plot, the correlation panel, the seasonal adjustment panel, and all cross-series plots are requested.
Output 39.3.1 through Output 39.3.4 show a selection of the plots created.
The graphical displays are requested by specifying the PLOTS= or CROSSPLOTS= options in the PROC TIMESERIES statement. For information about the graphics available in the TIMESERIES procedure, see the section ODS Graphics Names.
title "Illustration of ODS Graphics";
proc timeseries data=sashelp.workers out=_null_
                plots=(series corr decomp)
                crossplots=all;
   id date interval=month;
   var electric;
   crossvar masonry / dif=(1);
run;
Output 39.3.1: Series Plot
Output 39.3.2: Correlation Panel
Output 39.3.3: Seasonal Decomposition Panel
Output 39.3.4: Cross-Correlation Plot