Chart with Slider Prompt
Definition
Usage Information
|
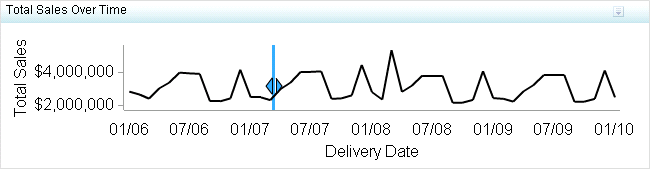
A chart with slider
prompt is commonly used when time is a factor that is of relevance.
Time values are usually along the horizontal axis. Use a chart with
slider prompt when data greatly varies in relation to time and it
is necessary for the user of the chart to understand values at specific
points in time.
|
|
|
This indicator type
can be used as the destination of a link only. For
more information about defining an indicator with a hyperlink, see Adding Links to Indicators or Other Content.
|
|
Display Settings
The following display settings are used in the preceding
figure. For more information, see “Sample Data Structure”
for this indicator.
You can customize the
following display settings for this indicator:
-
(Required) From the X-axis value list, select the column in your data that you want to use for the X-axis value in the indicator. When you view your indicator data, the columns in the data set are described by the values in the Column Name column. The selections available in the X-axis value list are all of the values in the Column Name column.
-
(Required) From the Y-axis value list, select the column in your data that you want to use for the Y-axis value in the indicator. When you view your indicator data, the columns in the data set are described by the values in the Column Name column. The selections available in the Y-axis value list are all of the values in the Column Name column.