Adding Interactions between Indicators

Overview

When you add two or more indicators to a dashboard, you can choose to have one indicator interact with one or more other indicators. The first indicator (the source) influences a second indicator (the target). Interactions enable business users to explore data directly within the dashboard.

Types of Interactions

There are three types of interactions:
Highlight data interactively
Also called data brushing, this type of interaction specifies that when the business user selects a specific value in the source indicator, related values in the target indicator are highlighted.
Filter data on a local system
Also called client-side filtering, this type of interaction specifies that when the business user selects a specific value in the source indicator, data in the target indicator is filtered, based on the selection.
This interaction filters data that is stored on the business user's computer. The filter can operate against any target parameter, and the filter can be very responsive. However, because this filter requires that a target indicator first load all data onto the business user's computer, load times might be long, and there is an upper limit to how much data can be used. If you are filtering more than 1000 lines of data, you must filter data on a remote server.
Filter data on a remote server
Also called server-side filtering, this type of interaction is conceptually the same as filtering data on a local system, except that the parameters are put into the query and the query is sent to the middle tier (the server) with the new parameters. Typically, this type of filter is not as responsive as a filter on a local system because of the time required to communicate with the middle tier, and the target parameters can be only parameters that are understood by the query. However, if you are filtering more than 1000 lines of data, you must filter data on a remote server.
Note: As of the second maintenance release of SAS BI Dashboard 4.31, all types of interaction support multiple selection. This enables the business user to select multiple items in the source indicator and highlight all of the affected items in the target indicator. For example, if you select more than one bar in a bar chart, all the affected rows in a target table indicator are highlighted. To select more than one item in a source indicator, press the CTRL key while clicking the items in the indicator. To support multiple selection in a filter data interaction, you must set up the indicator data source as required. For information, see Supporting Multiple Selections in a Filtered Data Interaction.

Example of Interactive Highlighting

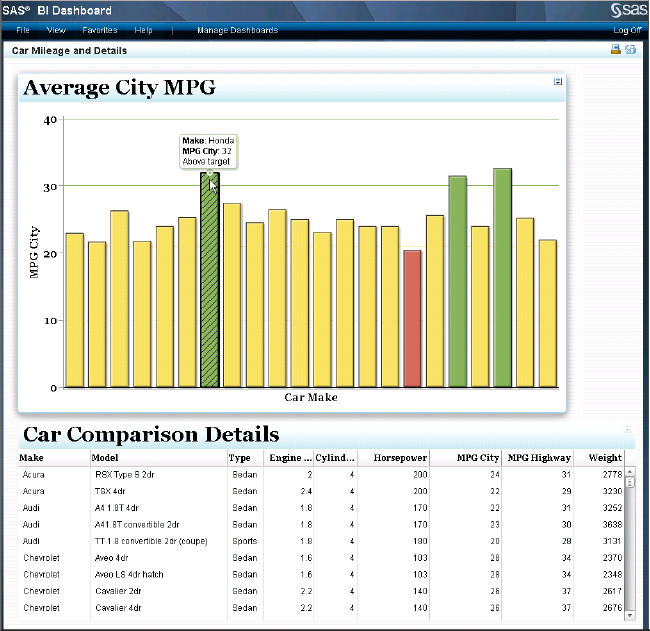
The following display is an example of a dashboard with two indicators. There is no interaction set up between the indicators, so as a business user explores data in one indicator, the other indicator remains static.
two indicators (without interactions) in a dashboard
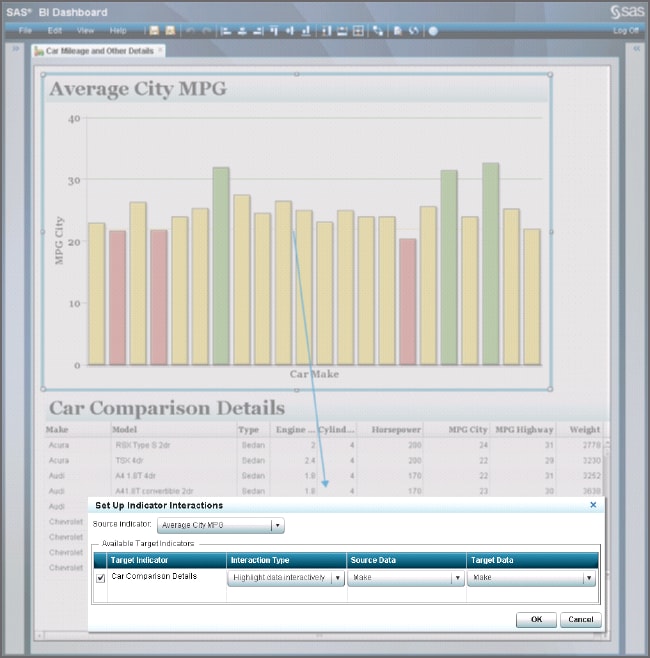
A dashboard designer then modifies the dashboard that contains the indicators in the SAS BI Dashboard designer:
  1. The dashboard designer sets up an interaction so that the source data Make in the bar chart indicator is mapped to the target data Make in the spark table indicator.
  2. The designer selects the interaction type Highlight data interactively.
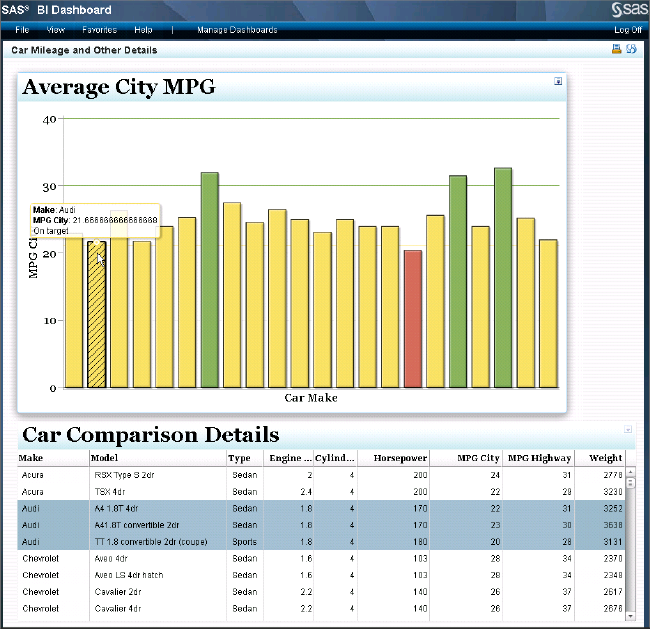
When a business user clicks a car make in the Average City MPG bar chart indicator, the following actions occur:
  1. The data Make in the bar chart indicator is set to the car make that the business user clicked.
  2. The data Make in the spark table indicator is also set to the car make that the business user clicked. This is because the data Make in the bar chart indicator is mapped to the data Make in the spark table indicator.
  3. The interaction is then processed, which results in the car make being highlighted in the spark table indicator.
In the SAS BI Dashboard designer, this indicator interaction is shown by an arrow from the bar chart indicator to the spark table indicator.
set up of the interaction between two indicators
To display this arrow, the dashboard designer selects Show interactions in the dashboard Properties pane.
Show interactions check box
Later, when the business user explores data in the modified dashboard, the car make clicked by the user in the bar chart indicator highlights the car make data in the spark table indicator.
highlighted data in the target indicator

Indicator Types That Support Interactions

Support for Data Filtering

When you click a data point in the source indicator, the data displayed by the target indicator changes to reflect the data point that you clicked. To set up data filtering, you must select a source indicator and a target indicator.
Not all indicator types support data filtering. The following tables list the exceptions to support. If an indicator type is not in the table, you can use that indicator type either as a source or a target indicator.
Note: If you are filtering more than 1000 lines of data, you must use filtering on a remote server.
Exceptions to Indicator Type Support for Filtering Data on Local Systems
Indicator Type
Use as Source
Use as Target
Dynamic text
No
Yes
Interactive summary and bar chart
No
No
Interactive summary and scatter plot
No
No
Interactive summary and targeted bar chart
No
No
KPI (footnote1)
Yes
No
Spark table
Yes
Yes (footnote2)
Exceptions to Indicator Type Support for Filtering Data on Remote Servers
Indicator Type
Use as Source
Use as Target
Chart with slider prompt
No
Yes
Dynamic text
No
Yes
Interactive summary and bar chart
No
No
Interactive summary and scatter plot
No
No
Interactive summary and targeted bar chart
No
No

Support for Interactive Highlighting

To set up interactive highlighting (also called data brushing), you must select a source indicator and a target indicator. Unless an indicator type is listed in the following table, you can use an indicator type either as a source or a target indicator.
Not all indicator types support interactive highlighting. The following table lists the exceptions to support. If an indicator type is not in the table, you can use that indicator type either as a source or a target indicator.
Exceptions to Indicator Type Support for Interactive Highlighting
Indicator Type
Use as Source
Use as Target
Chart with slider prompt
No
No
Dynamic prompt
No
No
Dynamic text
No
No
Interactive summary and bar chart
No
No
Interactive summary and scatter plot
No
No
Interactive summary and targeted bar chart
No
No
KPI (footnote3)
Yes (footnote4)
No

Guidelines for Defining Interactions

General

Use the following guidelines when designing interactions.
  • (Interactive highlighting) You can specify more than one target indicator.
  • (Interactive highlighting) You can specify only one parameter for highlighting.
  • You can chain interactions, such as indicator A that interacts with indicator B, which in turn interacts with indicator C.
  • When you define an indicator with both a link and an interaction, the link takes precedence over the interaction when the link opens in the same window as the interaction. For example, if you create a dashboard that opens a report and that interacts with another indicator, when the business user clicks the indicator, the report opens in the current window. If the link opens in a new window, then the business user sees the interaction in the current window and the link in a new window. For more information about defining an indicator with a hyperlink, see Adding Links to Indicators or Other Content.

Parameter Mapping

You can specify how one indicator influences another indicator by using parameters. A source indicator parameter is mapped to a target indicator parameter.
Note: In order to pass parameters between indicators, the target indicator must be based on either of the following data sources:
  • information map with prompted filters
  • stored process with parameters defined
  • You can specify more than one target indicator parameter.
  • The source indicator parameter and the target indicator parameter are not required to have the same name, but they must reference the same type of data. For example, the source indicator can have a data column named REGION_ID and the target indicator can have similar data contained in a data column named SALES_REGION_ID. By mapping REGION_ID to SALES_REGION_ID, you link together the two data columns.
  • The data can be contained in different data sources and different types of data sources. For example, a source indicator can have indicator data from an SQL query that maps to a target indicator that has indicator data from a stored process.
  • Optional parameters are not available for the following link types:
    • dashboard
    • SAS Information Delivery Portal page
    • SAS Information Map

Indicator Data

The following guidelines describe data restrictions when using interaction.
Interactive highlighting
Any type of indicator data can be used for interactive highlighting.
Filtering data on a local system
Any type of indicator data can be used for this type of interaction.
CAUTION:
Do not specify a default value for the mapped parameters that severely limits the amount of data returned by the indicator data.
This limited data, when filtered further on the local system, can reduce the amount of data to few, or no, matching rows.
Filtering data on a remote server
  • The only indicator data that can be used with this type of interaction is an information map or a stored process. In both cases, you must supply a default value for a prompt.
  • Unlike filtering data on a local system, which can be based on a target parameter that does not have a prompt defined in the target indicator data, filtering data on a remote server can be based only on a target parameter that is defined in the target indicator data.
  • An information map must have at least one filter defined, and this filter must be a mapped parameter.
    CAUTION:
    Do not change the default value of a prompt in another application while SAS BI Dashboard is running.
    Log off from SAS BI Dashboard, change the value, and then log in again.
  • When using a prompt based on a date with an information map, ensure that you pass values to the prompt in a format that the prompt accepts. For more information, see Valid Date Formats for Information Maps.

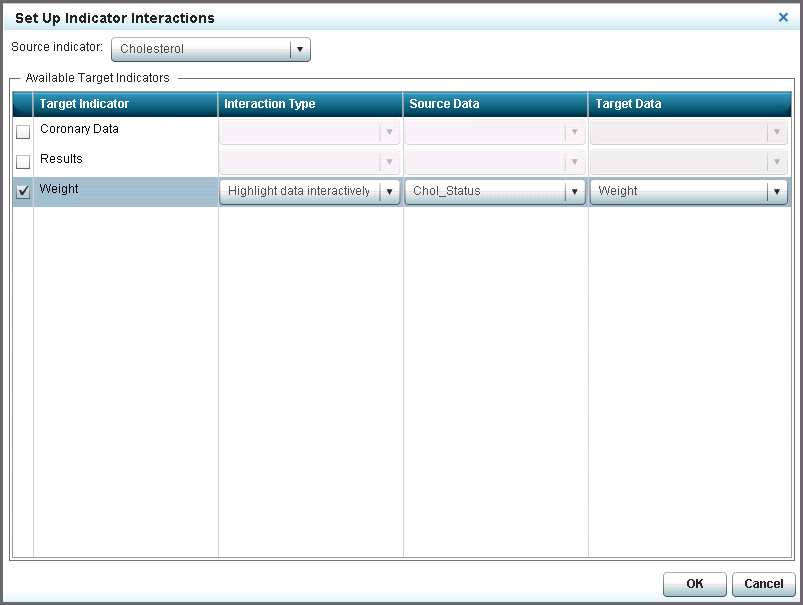
Set Up an Indicator Interaction

To set up an interaction between one or more indicators, complete the following steps in the dashboard workspace:
  1. Add at least two indicators to a dashboard.
  2. Select the indicator to be the source of the interaction, and then click Set Up interactions icon. The Set Up Indicator Interactions window appears.
    Set Up Indicator Interactions window
  3. In the Available Target Indicators group, the table lists the other indicators that are available in the dashboard. Select one or more of these indicators to be targets of the interaction.
  4. For each selected indicator, select the type of interaction to use from the list in the Interaction Type column.
  5. For each selected indicator, select the source data column to use from the list in the Source Data column. When the user clicks this data in the source indicator, the interaction is initiated.
  6. For each selected indicator, select the target data column to use from the list in the Target Data column. When the user clicks the source data in the source indicator, the target data reacts in the target indicator.
    Note: The target indicator data, either information map or stored process, must have a prompted filter. When you set up the interaction, the only Target Parameter choices that are available are prompted filters.
  7. Click OK to save the interaction and exit the window.
Tip
After you have set up the interactions, click Show interactions in the dashboard Properties pane to graphically view the interactions. To test the interaction, you must open the dashboard in the SAS BI Dashboard viewer or SAS BI Dashboard portlet.

Supporting Multiple Selections in a Filtered Data Interaction

Overview

As of the second maintenance release of SAS BI Dashboard 4.31, you can now add support in a source indicator such that multiple selections affect the data filtering in the target indicator.
The indicator data used by the target indicator must be one of the following types:
  • SAS Information Map with prompted filters
  • SAS Stored Process with parameters defined

Support for Multiple Selection in Filtered Data

To set up multiple selection support for data filtering, you must select a source indicator that supports multiple selection for data filtering.
Not all indicator types support multiple selection. The following indicators do not provide this support. If an indicator type is not in this list, you can use that indicator type as a source indicator.
  • chart with slider prompt
  • custom graph
  • dynamic prompt
  • dynamic text
  • interactive summary and bar chart
  • interactive summary and scatter plot
  • interactive summary and targeted bar chart
  • KPI

Requirements for SAS Information Maps

For a SAS Information Map to support multiple selections, you must make the following selection when creating a prompted filter in SAS Information Map Studio:
  1. In the Edit Prompt window, click the Prompt Type and Values tab.
  2. In the Number of values list, select Multiple values.
  3. Click OK.

Requirements for SAS Stored Processes

For a SAS Stored Process to support multiple selections, you must use the %_EG_WHEREPARAM macro that is provided by SAS Enterprise Guide. The following code shows an example of how to use this macro:
PROC SQL;
CREATE TABLE WORK.RESULTS AS
   SELECT * from mydata.sales WHERE %_eg_WhereParam(year, yearPrompt, 
   IN, TYPE=N);
QUIT;
yearPrompt is the prompt for a year, yearPrompt0 represents the first value, and yearPromptN represents the Nth value.
See the SAS Enterprise Guide documentation for more information about this macro.
FOOTNOTE 1:Includes all KPI indicator subtypes.[return]
FOOTNOTE 2:To use a spark table indicator as a target, the Spark group by and Spark X axis settings must be set to (none). This means that you cannot show a sparkline when you use a spark table indicator as a target for a filter.[return]
FOOTNOTE 3:Includes all KPI indicator subtypes.[return]
FOOTNOTE 4:The KPI does not support selection of multiple gauges.[return]