The main responsibility of a BarChartTableDataModel is to determine which data variables are used in the bar chart and what role each variable plays. A BarChartTableDataModel's primary roles are
The following code fragment graphs energy production by assigning the Category and Response variable roles to variables named EnergyType and Produced:
// Create a data source that must contain a string column
// named EnergyType and a numeric column named Produced
   javax.swing.table.TableModel dataTable = <...>;

// Create a data model and attach the data source to it
   BarChartTableDataModel dataModel =
     new BarChartTableDataModel();
   dataModel.setModel(dataTable);

// Assign the Category and Response variable roles
// to appropriate variable(s)
   dataModel.setCategoryVariable(
     new ClassificationVariable("EnergyType"));
   dataModel.setResponseVariable(
     new AnalysisVariable("Produced"));

// Create a BarChart and attach the data model to it
   BarChart barChart = new BarChart();
   barChart.setDataModel(dataModel);
When a data model is assigned to a BarChart, the chart summarizes the data before displaying it. During summarization
The following statistics are the default calculations:
The AnalysisVariable constructor can be used to specify a statistic to calcuate. The following code fragment specifies a mean:
AnalysisVariable response=new AnalysisVariable(
  "Var1"                            // column for Response role
  ,GraphConstants.STATISTIC_MEAN    // statistic to calculate
);
BarChartTableDataModel dataModel=new BarChartTableDataModel();
dataModel.setResponseVariable(response);
By default, a BarChart summarizes the data, even if the TableModel's data values have already been summarized. When the values in the data source have already been summarized, you can improve performance by turning off data summarization. Do this by setting the StatisticEnabled boolean to false as follows:
BarChartTableDataModel dataModel=new BarChartTableDataModel();
dataModel.setStatisticEnabled(false);
By default, a discrete categorization is performed when a numeric data column is specified for the CategoryVariable role. The format parameter on the ClasificationVariable's constructor can be used to specify the type of categorization (or midpointing) operation to use.
For example, for a numeric data column named Sample, the following code fragment formats the numeric values into categories Initial, Interim, and Final, and then specifies the numeric variable for the Category role:
        try {
             com.sas.text.SASUserDefinedFormat.createFormat(
                 "value myFormat 1 - 2 = 'Initial'"
                 +              "3 - 4 = 'Interim'"
                 +              "5 - 6 = 'Final'");
            } catch (java.text.ParseException e) {
        java.lang.System.out.println("error=" + e.getMessage());
      }
ClassificationVariable myFormattedVar=
  new ClassificationVariable("Sample", "myFormat");

BarChartTableDataModel dataModel=new BarChartTableDataModel();
dataModel.setCategoryVariable(myFormattedVar);
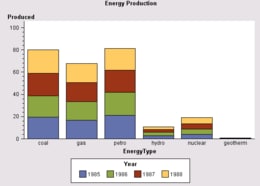
To identify data subgroups according to the values of a ClassificationVariable, assign the SubroupVariable role to the appropriate classification variable. Each bar in the chart is then divided into segments that represent the values of the Subgroup variable.
For example, if the bars in a chart represent energy production, a variable named Year might be assigned the Subgroup role. The Subgroup role would cause each bar to be subdivided into segments that represent each year's energy production. The assignment would resemble the following:
dataModel.setSubgroupVariable(new ClassificationVariable("Year"));
Different colored bar segments are used to represent each unique value of the Subgroup variable.
A BarChartTableDataModel does not support error values in the data model. If a constructor for an AnalysisVariable that is used in the chart specifies high or low error values, those error values are not used in the chart.
Multiple Response variables can be plotted against the same Category variable by adding the variables to an AnalysisVariableList, and then assigning that list rather than an individual variable to the Response role.
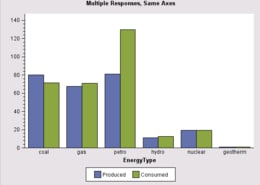
The following code fragment assigns the Category role to variable EnergyType, and the Response role to variables named Produced and Consumed:
dataModel.setCategoryVariable(
  new ClassificationVariable("EnergyType"));

AnalysisVariableList multiResponse=new AnalysisVariableList(
  new AnalysisVariable[] {
      new AnalysisVariable("Produced"),
      new AnalysisVariable("Consumed")
  } );
dataModel.setResponseVariable(multiResponse);
For each value of the category variable, the response-variable bars are positioned side-by-side for ease of comparison. A different color bar is used for each response variable, and a legend is displayed by default to indicate which color represents each variable.
Target values can be displayed for response values in the chart by using the
AnalysisVariable constructor to specify
the variable(s) that store the target values
and then assigning that Analysis variable to the chart's Response role.
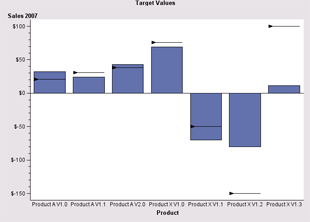 BarChart with Target Values |
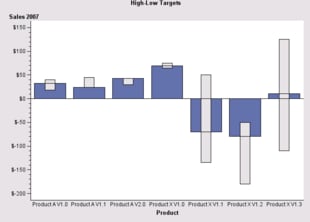 BarChart with High-Low Values |
If you specify one target variable on the AnalysisVariable constructor, the target variable can represent any type of target values, and the values are represented in the chart by a single marker symbol on each bar that has a corresponding target value.
If you specify two target variables on the AnalysisVariable constructor, the target variables typically represent high and low values, and the target values are represented in the chart by a narrow bar that spans those values. A bar chart that depicts high and low values looks similar to a box plot.
The following code fragment specifies two variables: one with high values and one with low values:
dataModel.setResponseVariable(new AnalysisVariable(
      "Sales"                        // data column name
    , "dollar"                       // format
    ,  null                          // informat
    , "Sales 2007"                   // label
    ,  GraphConstants.STATISTIC_SUM  // statistic
    , "High"                         // data column with high values
    , "High Target"                  // label
    , "Low"                          // data column with low values
    , "Low Target"                   // label
));
Separate BarCharts can be generated for each value of a ClassificationVariable by assigning either the ColumnVariable or RowVariable role to that variable.
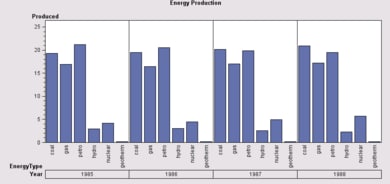
For example, when charting energy production, a variable named Year might be assigned to the Column role so that a separate chart is generated for the production in each year. The assignment would resemble the following:
dataModel.setColumnVariable(new ClassificationVariable("Year"));
If the Column role is assigned, charts are aligned horizontally by the variable's values. Each column has its own category-axis scale, and the charts share the same response axis.
If the Row role is assigned, charts are aligned vertically by the variable's values. Each row has its own category and response axes.
The Column and Row variable roles can both be assigned to the same graph. In that case, a separate bar chart is produced for each unique pair of (column, row) values, and the plots are displayed in a grid. For example, when charting product sales, a variable named Year might be assigned to the Column role and a variable named Region might be assigned the Row role. In this case, a separate chart is generated for each region's sales in each year.
The following table summarizes the BarChartTableDataModel variable roles and the type of data each role supports.
| Variable Role | Class Type | Numeric | String | Multiple Variables |
|---|---|---|---|---|
| CategoryVariable* Assigns category-axis variable |
ClassificationVariable | Yes | Yes | No |
| ResponseVariable Assigns response-axis variable |
AnalysisVariable | Yes | No | Yes |
| Response2Variable Assigns variable for second response axis |
AnalysisVariable | Yes | No | No |
| SubgroupVariable Divides bars into subgroup segments |
ClassificationVariable | No | Yes | No |
| CategorySortVariable Determines sort order for bars. |
Variable | Yes | Yes | No |
| ColumnVariable Aligns multiple charts in columns |
ClassificationVariable | Yes | Yes | Yes |
| RowVariable Aligns multiple charts in rows |
ClassificationVariable | Yes | Yes | Yes |
| * required variable | ||||
To generate a graph, a BarChart needs a data column for the CategoryVariable role. If the role is not assigned in the program code, a BarChart selects the first string column found in the PieChartTableDataModel and uses it as its Category variable. If there is no string column in the data, then it selects the first numeric column.
This default behavior occurs only when the Category role is not assigned. If the role is assigned to a variable that does not exist in the data, the BarChart cannot display a graph.
If the ResponseVariable role is not assigned in the program code, then the bar heights represent a frequency count of the Category values. If the ResponseVariable role is assigned, then the default statistic for the bar heights is the sum of the response values for each category value.
A BarChartTableDataModel fires property change events when
For example, if the name property is changed in the ClassificationVariable that has been assigned the CategoryVariable role, the BarChartTableDataModel fires a ProeprtyChangeEvent stating that the CategoryVariable has changed.
When variable roles are assigned, the BarChartTableDataModel does not confirm that the variables exist in the TableModel. Thus, assigning a non-existent data column to a variable role may mean that the BarChart cannot display a graph. For example, if the CategoryVariable role is assigned to a Product column but the TableModel does not contain a Product column, then the BarChart fails to produce a graph.
If the CategoryVariable role is correctly assiged to an existing variable but another role is incorrectly assigned, the BarChart displays a graph without the incorrect role. For example, if the CategoryVariable role is correctly assigned but the ColumnVariable role is not, a graph using the Category role is generated, but the Column role is ignored.