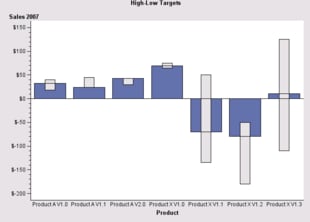
// SetHighLowTargets:
// To set target values on a BarChart, use the AnalysisVariable
// constructor to specify the variable(s) that store the
// target values and then assigning that Analysis variable
// to the chart's Response role. This example sets High
// and Low target values.

   import com.sas.graphics.components.barchart.BarChart;
   import com.sas.graphics.components.barchart.BarChartTableDataModel;
   import com.sas.graphics.components.AnalysisVariable;
   import com.sas.graphics.components.ClassificationVariable;
   import com.sas.graphics.components.GraphConstants;
   import javax.swing.table.DefaultTableModel;
   import java.awt.BorderLayout;
   import java.awt.Color;
   import java.awt.Container;
   import java.awt.event.WindowAdapter;
   import java.awt.event.WindowEvent;
   import javax.swing.JFrame;
   import javax.swing.JPanel;

   public class SetHighLowTargets extends JPanel  {
     private SetHighLowTargets  theApp;
     public SetHighLowTargets() {
        setLayout(new BorderLayout());

     // Create a BarChart and a data source
        BarChart barChart=new BarChart();
        SampleData dataTable=new SampleData();

     // Create a data model and attach the data source
        BarChartTableDataModel dataModel=
                  new BarChartTableDataModel();
        dataModel.setModel(dataTable);

     // Assign the Category variable role and Response
     // variable role to appropriate variable
        dataModel.setCategoryVariable(new ClassificationVariable(
              "Product" // Data Column name
             , null // format
             , null // informat
             , null // label
             , GraphConstants.SORT_ASCENDING // sort
        ));
        dataModel.setResponseVariable(new AnalysisVariable(
              "Sales"                       // data column name
            , "dollar"                      // format
            ,  null                         // informat
            , "Sales 2007"                  // label
            ,  GraphConstants.STATISTIC_SUM // statistic
            , "High"                        // data column with high values
            , "High Target"                 // label
            , "Low"                         // data column with low values
            , "Low Target"                  // label
        ));

     // Assign the data model to the BarChart
        barChart.setDataModel(dataModel);

     // Set a graph title
        barChart.getTitle1().setText("High-Low Targets");
        add(barChart, BorderLayout.CENTER);
      }
   // Create the data source
      static private class SampleData extends DefaultTableModel {
        private static Class  columnClass[] = {String.class, Double.class, Double.class,
                                               Double.class, Double.class, Double.class, Double.class };
        private static String columnNames[] = {"Product", "ProductN", "Sales", "SalesTarget", "TargetDelta", "Low", "High" };
          public SampleData() {
            super();
            Object data[][] = {
              {"Product A V1.0", new Double(4), new Double(32),  new Double(21),   new Double(32-21),   new Double(18),   new Double(40) },
              {"Product A V1.1", new Double(3), new Double(24),  new Double(31),   new Double(24-31),   new Double(28),   new Double(45) },
              {"Product A V2.0", new Double(8), new Double(43),  new Double(38),   new Double(43-38),   new Double(30),   new Double(40) },
              {"Product X V1.0", new Double(2), new Double(69),  new Double(76),   new Double(69-76),   new Double(65),   new Double(75) },
              {"Product X V1.1", new Double(2), new Double(-70), new Double(-50),  new Double(-70-50),  new Double(-135), new Double(50) },
              {"Product X V1.2", new Double(2), new Double(-80), new Double(-150), new Double(-70-150), new Double(-180), new Double(-50)},
              {"Product X V1.3", new Double(6), new Double(11),  new Double(100),  new Double(11-100),  new Double(-110), new Double(125)}
            };
            setDataVector(data, columnNames);
          }
          public Class getColumnClass(int column) {
	    return columnClass[column];
	  }
      }
      public static void main(String[] args) {
      	  JFrame frame = new JFrame("BIP Graph Sample");
      	  Container container = frame.getContentPane();
          container.setLayout(new BorderLayout());
          container.setBackground(Color.white);

          JPanel bipPanel = new JPanel();
          bipPanel.setLayout(new BorderLayout());
          SetHighLowTargets  bipGraphSample = new SetHighLowTargets();

          bipPanel.add(bipGraphSample, BorderLayout.CENTER);
          container.add(bipPanel, BorderLayout.CENTER);

          frame.setSize(700,525);
          frame.addWindowListener(new WindowAdapter() {
              public void windowClosing(WindowEvent e) {
                     System.exit(0);
              }
          } );
          frame.setVisible(true);
      }
   }