<%// SetHighLowTargets:%>
<%
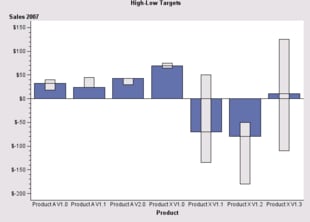
// To set target values on a BarChart, use the AnalysisVariable
// constructor to specify the variable(s) that store the
// target values and then assigning that Analysis variable
// to the chart's Response role. This example sets High
// and Low target values.
%>
<%@page import="com.sas.servlet.tbeans.graphics.html.BarChart,
com.sas.graphics.components.barchart.BarChartTableDataModel,
com.sas.graphics.components.AnalysisVariable,
com.sas.graphics.components.ClassificationVariable,
com.sas.graphics.components.GraphConstants,
javax.swing.table.DefaultTableModel"
%>
<%
// Create a BarChart and a data source
BarChart barChart=new BarChart();
// Create the data source
String columnNames[] = {"Product", "ProductN", "Sales", "SalesTarget", "TargetDelta", "Low", "High" };
DefaultTableModel dataTable = new DefaultTableModel();
Object data[][] = {
{"Product A V1.0", new Double(4), new Double(32), new Double(21), new Double(32-21), new Double(18), new Double(40) },
{"Product A V1.1", new Double(3), new Double(24), new Double(31), new Double(24-31), new Double(28), new Double(45) },
{"Product A V2.0", new Double(8), new Double(43), new Double(38), new Double(43-38), new Double(30), new Double(40) },
{"Product X V1.0", new Double(2), new Double(69), new Double(76), new Double(69-76), new Double(65), new Double(75) },
{"Product X V1.1", new Double(2), new Double(-70), new Double(-50), new Double(-70-50), new Double(-135), new Double(50) },
{"Product X V1.2", new Double(2), new Double(-80), new Double(-150), new Double(-70-150), new Double(-180), new Double(-50)},
{"Product X V1.3", new Double(6), new Double(11), new Double(100), new Double(11-100), new Double(-110), new Double(125)}
};
dataTable.setDataVector(data, columnNames);
// Create a data model and attach the data source
BarChartTableDataModel dataModel=
new BarChartTableDataModel();
dataModel.setModel(dataTable);
// Assign the Category variable role and Response
// variable role to appropriate variable
dataModel.setCategoryVariable(new ClassificationVariable(
"Product" // Data Column name
, null // format
, null // informat
, null // label
, GraphConstants.SORT_ASCENDING // sort
));
dataModel.setResponseVariable(new AnalysisVariable(
"Sales" // data column name
, "dollar" // format
, null // informat
, "Sales 2007" // label
, GraphConstants.STATISTIC_SUM // statistic
, "High" // data column with high values
, "High Target" // label
, "Low" // data column with low values
, "Low Target" // label
));
// Assign the data model to the BarChart
barChart.setDataModel(dataModel);
// Set a graph title
barChart.getTitle1().setText("High-Low Targets");
// Set HTTP-specific response and request functionality
barChart.setResponse(response);
barChart.setRequest(request);
// Write the chart to the display
barChart.write(out);
%>