<%// SpecifyColumns:%>
<%
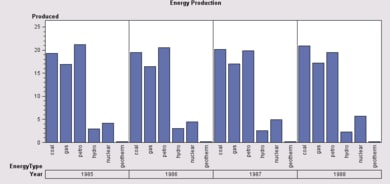
// To generate a bar chart for each value of a categorical variable
// and align the charts horizontally, assign the Column variable role
// to an appropriate categorical variable.
%>
<%@page import="
com.sas.servlet.tbeans.graphics.html.BarChart,
com.sas.graphics.components.barchart.BarChartTableDataModel,
com.sas.graphics.components.AnalysisVariable,
com.sas.graphics.components.ClassificationVariable,
com.sas.swing.models.TableModelAdapter,
com.sas.models.SimpleTable"
%>
<%
// Create a BarChart instance
BarChart barChart = new BarChart();
// Create a simple SAS table and add data to it
SimpleTable table = new SimpleTable();
%>
<%@ include file="EnergyData.jsp" %>
<%
// Convert a simple SAS table to a simple Java Swing table
TableModelAdapter tma = new TableModelAdapter(table);
tma.setFormattedDataUsed(false);
// Create a data model and attach the data source
BarChartTableDataModel dataModel=
new BarChartTableDataModel(tma);
// Assign the data model to the BarChart
barChart.setDataModel(dataModel);
// Assign the Category variable role, and optionally the
// Response variable role, to appropriate variable(s)
dataModel.setCategoryVariable(
new ClassificationVariable("EnergyType"));
dataModel.setResponseVariable(
new AnalysisVariable("Produced"));
dataModel.setColumnVariable(
new ClassificationVariable("Year"));
// Set a graph title and size
barChart.getTitle1().setText("Energy Production");
barChart.setWidth(600);
barChart.setHeight(300);
// Set HTTP-specific response and request functionality
barChart.setResponse(response);
barChart.setRequest(request);
// Write the chart to the display
barChart.write(out);
%>