SAS Web Report Studio
SAS Web Report Studio 4.2: Exploring Changes to the Report-Building Workflow
A software orientation for report authors who are familiar with building reports in SAS Web Report Studio 3.1
For more than three years, SAS Web Report Studio has provided an intuitive user interface that enables users at all technical skill levels to create, view, and explore centrally stored reports. In March 2009, SAS released a major upgrade to SAS Web Report Studio that includes a vastly enhanced user interface, particularly in the area of report building. To complement the step-by-step instructions that are provided in the SAS Web Report Studio 4.2: User's Guide, this overview presents a product orientation for experienced report authors who want to quickly familiarize themselves with the redesigned workflow. Specifically, this overview focuses on initiating the following report-building tasks:1
- accessing the report builder
- initiating data selection
- changing aggregation settings
- changing formatting
- creating section filters
- inserting and positioning objects
- displaying context menus for individual objects
- defining and editing group breaks
- creating and editing headers and footers
- synchronizing objects
- managing sections
- saving the report
Accessing the Report Builder
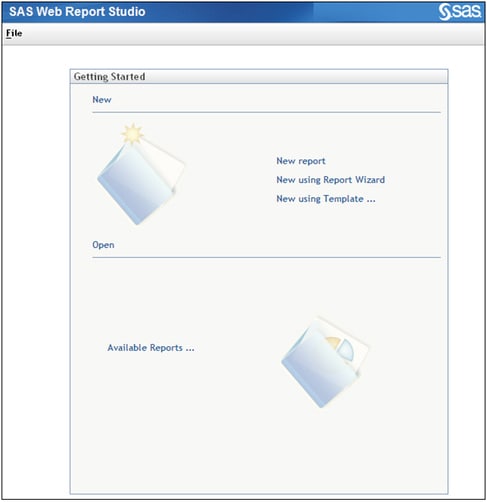
When you log on to SAS Web Report Studio 4.2 for the first time, a Welcome window2 similar to the following is displayed:
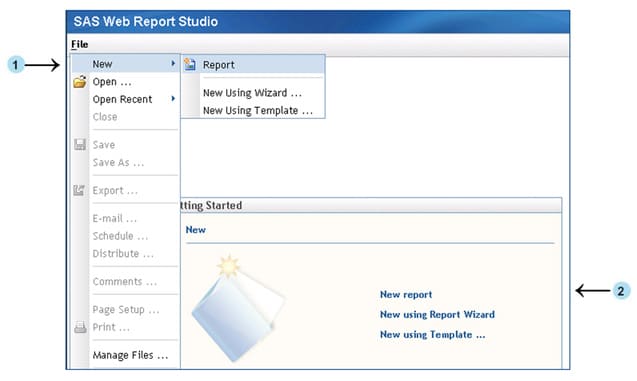
To begin building a new report, you access the report builder in essentially the same way that you do in SAS Web Report Studio 3.1.
- Select File ► New ► Report.3
- Click the New report link to access the report builder, as shown in the following figure:
When you click New Report, the redesigned report builder is displayed, as shown in the following figure:
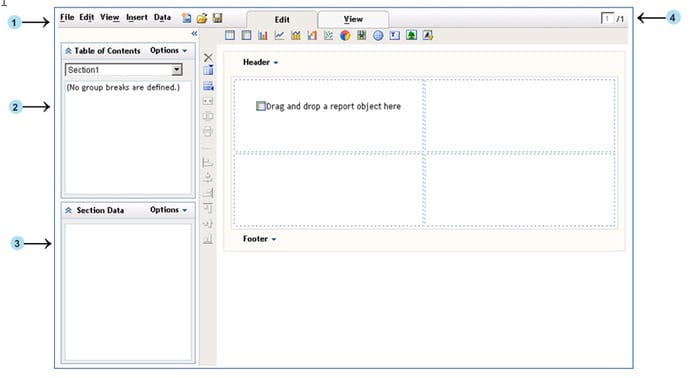
The following information corresponds to the numbered sections that are shown in the preceding figure:
- The new menus are used to perform tasks such as selecting data, managing sections, filtering, inserting objects, and creating group breaks. Another way to perform these tasks is by using the two new navigation and data-selection panels (Table of Contents and Section Data).
- The Table of Contents panel is used to manage sections and group breaks.
- The Section Data panel is used to select, filter, format, and synchronize data.
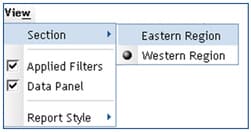
- Instead of section tabs, a navigational box displays the section that is currently open and the number of sections in the report. To view a different section, type the section number in the box and press ENTER or select View ► Section and then select the name of the section that you want to open.
Tip: The Table of Contents and the Section Data panels themselves are contained within a data panel that can be collapsed horizontally to increase the report viewing area. To do that, click  or select View ► Data Panel. To collapse an individual panel horizontally, click
  .
.
Initiating Data Selection
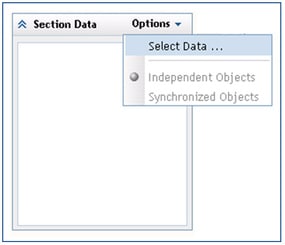
You select data for a new report in the Select Data dialog box, which uses essentially the same interface as SAS Web Report Studio 3.1. You can open the Select Data dialog box in two ways:
- From the Section Data panel, select Options ► Select Data.
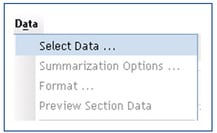
- From the menu bar, select Data ► Select Data.
Changing Aggregation Settings
In release 3.1, you change aggregation settings in the Aggregate or Detail dialog box.
In release 4.2, that dialog box is renamed Summarization Options.
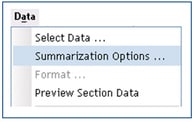
After you select data items for the report, you can change the aggregation settings by selecting Data ► Summarization Options.
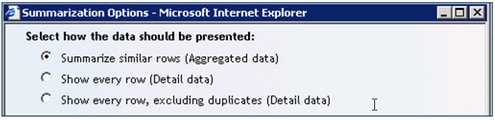
This selection opens the Summarization Options dialog box, which has essentially the same functionality as the Aggregate or Detail dialog box in release 3.1. However, the option names are now easier to understand.
Note: In the initial configuration, only users in the Advanced role can change aggregation settings. If you are not in this role, the Summarization Options menu item is not visible.
Changing Formatting
In release 3.1, data items that support format changes include a Format link in the Select Data section. The link opens the Define a Format dialog box.
In release 4.2, you use either of the following methods to open the Define a Format dialog box:
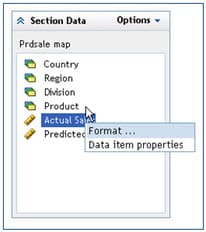
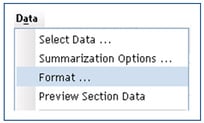
- Right-click the data item that you want to format in the Section Data panel to open a context menu, and then select Format.
- From the menu bar, select Data ► Format.
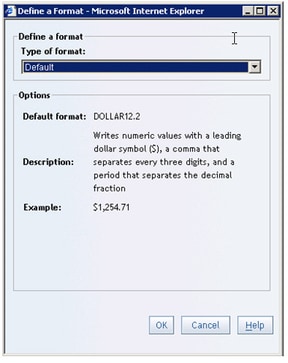
In release 4.2, the Define a Format dialog box contains more information about the default format for the data item (if that information is available). In the following example, the default format is DOLLAR12.2, and a description and example of DOLLAR12.2 is displayed.
Note: As in release 3.1, you can modify the format for a category only if a user-defined format is assigned to the category in the information map.
Creating Section Filters
In release 3.1, you select predefined filters from a list box that appears next to the associated data item in the Select Data section of the report builder. To create a new filter for a data item, you click the Create Filter button.
In release 4.2, filters for the entire section are selected, created, and combined from the new Section Filters dialog box. After you select data items for the report, use one of the following methods to open the Section Filters dialog box. You do not need to select a data item first.
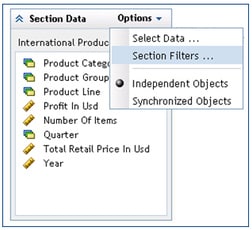
- From the Section Data panel, select Options ► Section Filters.
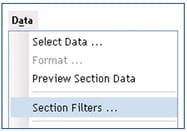
- From the menu, select Data ► Section Filters.
The new Section Filters dialog box, shown in the following figure, provides centralized access to a variety of filtering tasks such as selecting predefined filters, creating new filters, and managing filter combinations.
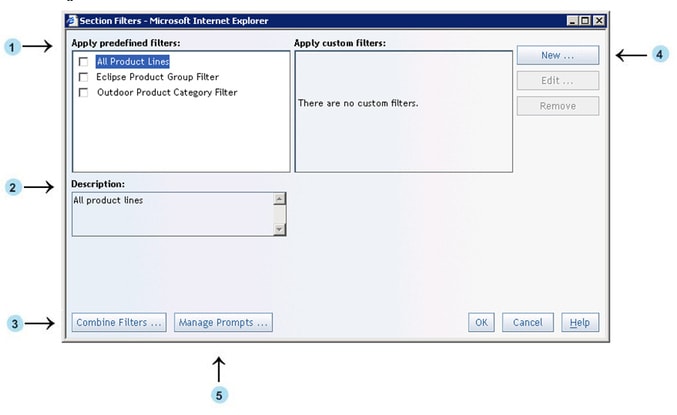
The following information corresponds to the numbered parts that are shown in the dialog box above:
- Filters that exist in the selected information map are displayed in the Apply predefined filters box.4
- If the selected filter has a description, the text appears in the Description text box.
- If more than one filter is selected, you can click Combine Filters to modify the default expression. As in release 3.1, filters are joined using the AND operator, which means that the query results must match all selected filters.
- The New button opens the redesigned Create Custom Filter dialog box. The new design is discussed in the next section, "Exploring the New Workflow for Creating Customer Filters."
- If the report has prompted filters that support dynamic value generation, you can click Manage Prompts to specify dependencies between prompts. By defining dependencies, you can create cascading, prompted filters that provide different filter choices depending on a previously selected filter value. This new feature is discussed in the section, "Exploring the New Prompt Dependency Feature."
Tip: In release 4.2, you can apply more than one filter per data item.
Exploring the New Workflow for Creating Custom Filters
To access the Create Custom Filter dialog box, click New in the Section Filters dialog box. To improve workflow, this dialog box has been redesigned as follows.
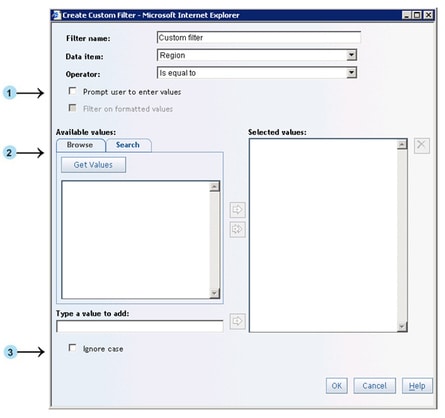
The following information corresponds to the numbered parts that are shown in the dialog box above:
- Fields for creating prompted filters are now hidden by default. To see the fields, select the Prompt user to enter values check box. For more information, see the next section, "Exploring the New Workflow for Creating Prompts."
To improve performance, filter values are not automatically loaded. If the data item supports dynamic value generation5, you can click Get Values on the Browse tab to load the list of values. The new Search tab enables you to find filter values by using one of these criteria: Contains, Exactly Matches, Starts with, Ends with, and Matches Pattern.
- You now have the option to ignore casing when you filter on formatted and unformatted values. Previously, when you filtered on unformatted values, filter values had to match the casing of the values in the data source.
Exploring the New Workflow for Creating Prompts
As discussed in the previous section, in release 4.2, the prompt options are hidden until you select the Prompt user to enter values check box.
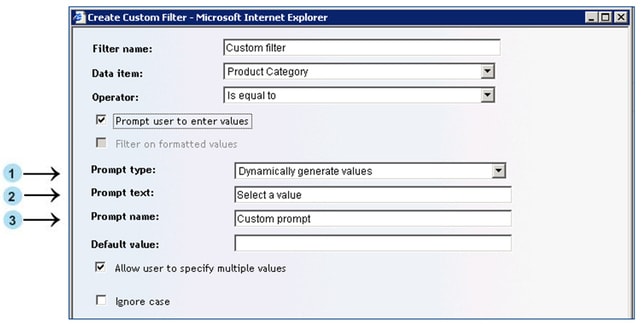
The following information corresponds to the numbered parts that are shown in the dialog box above:
- As in release 3.1, the Prompt type choices depend on the value-generation method that is specified for the selected data item. For example, if the data item supports dynamic value generation, then the Prompt type list contains these selections:
- Dynamically generate values
- Create a list of values
- Request user to type values
- The Prompt text box replaces the Message for user box that was used in release 3.1.
- The new Prompt name box enables you to create unique prompt names so that report viewers can distinguish between prompted filters that are based on the same data item. (Recall that you can now have more than one filter per data item.) The prompt name appears in the prompt window and in the Report Linking dialog box.6
Exploring the New Prompt Dependency Feature
One of the most anticipated new features in release 4.2 is the ability to define prompt dependencies. You perform this task in the Manage Prompts dialog box after you have defined some prompts. To access the dialog box, click Manage Prompts in the Section Filters dialog box. (See the section "Creating Section Filters.") The Manage Prompts dialog box is shown below with one dependency already defined.
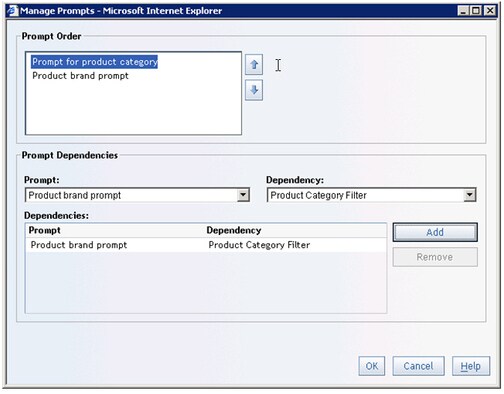
Only filters that are selected for the report are available in this dialog box. The Dependency list contains all selected filters. The Prompt list contains only those prompts that support dynamic value generation. There are two ways that you might define dependencies.
You can define dependencies between two or more prompted filters. For example, you might define a dependency between a Product Category prompt and a Product Name prompt. In this case, if you select Clothing as the value for a Product Category filter, then the subsequent filter for Product Name might be restricted to choices such as Eclipse Sportswear, Tracker T-shirts, and Green Tomato Knitwear. However, if you select Camping Gear as the value for the Product Category filter, then the Product Name filter might be restricted to choices such as Orion Trekking Poles, Eclipse Sleeping Bags, and Tracker Backpacks.
You can define a dependency between a prompted filter and a static filter. For example, you might define a dependency between a static Product Category filter for outdoor products and a Product Name prompt. In this case, the report might contain one prompt for Product Name that only displays values such as Gloves & Mittens, Tents, and Parkas.
Inserting and Positioning Objects
In release 3.1, you insert and position objects by using the horizontal and vertical toolbars. This feature has not changed in release 4.2. However, some of the horizontal toolbar icons have been redesigned, and there is a new Tile charts icon ![]()

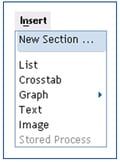
In release 4.2, you also have the option to insert objects from the menu bar. Select Insert ► object to place the object into the next available cell in the layout grid.
Displaying Context Menus for Individual Objects
In release 3.1, tables, graphs, and maps have attached toolbars that provide access to functionality such as filtering, sorting, conditional highlighting, and adding totals.
In release 4.2, the toolbars are gone. You access most of the functionality that was available from the toolbars from a right-click context menu. For example, here is the context menu for a list table that is displayed in the report builder.7
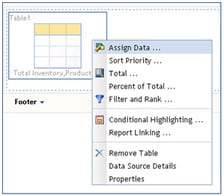
For simplicity, some of the option names have changed. For example, the Table Information and the Graph Information options are now combined under Data Source Details. The Table Data and Graph Data options are now combined under Assign Data.
Defining and Editing Group Breaks
In release 3.1, you use the Group breaks menu in the Report section to define group breaks.
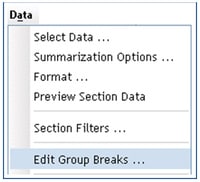
In release 4.2, after you select data items for the report, you use one of the following methods to open the Group Breaks dialog box:
- From the Table of Contents panel, select Options ► Group Breaks.
- From the menu, select Data ► Edit Group Breaks.
The Group Breaks dialog box is essentially the same as in release 3.1.
Creating and Editing Headers and Footers
In release 3.1, you use the Header and Footer links in the Report section to create a header or footer for your report.
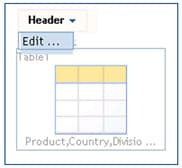
In release 4.2, you use one of these methods to open the Edit Header or Edit Footer dialog box:
- From the menu, select Edit ► Header or Edit ► Footer.
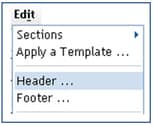
- In the layout area, select Header ► Edit or Footer ► Edit.
The Edit Header and Edit Footer dialog boxes are essentially the same as in release 3.1.
Synchronizing Objects
In release 3.1, a drop-down list on the horizontal toolbar enables you to specify whether the tables and the graphs should be independent or synchronized.
In release 4.2, after you select data items for the report, you use one of these methods in order to synchronize the results:8
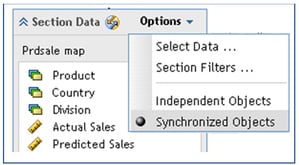
- From the Section Data panel, select Options ► Synchronized Objects.
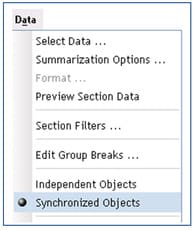
- From the menu, select Data ► Synchronized Objects.
When a report is synchronized, a synchronization icon ![]() appears in the Section Data panel.
appears in the Section Data panel.
In release 3.1, objects in a synchronized report are displayed within a shaded box. In addition, the report includes a data panel that enables you to perform some query modifications and reassign data items to different functions. You cannot control access to the data panel.
In release 4.2, objects in synchronized reports are not displayed within a shaded box. The data panel has been replaced by the Section Data panel, which is accessible only to authorized report viewers. When it is available, the Section Data panel can be used to modify the section query for both independent and synchronized reports.
Managing Sections
To insert a new section in release 3.1, you use the Section menu, which appears to the right of the last section tab in the Select Data section.
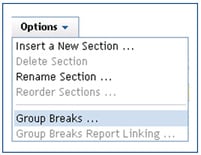
To insert a new section in release 4.2, you use one of these methods:
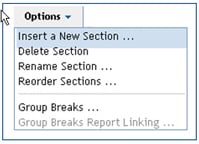
- From the Table of Contents panel, select Options ► Insert a New Section.
- From the menu bar, select Insert ► New Section.
In release 3.1, you also use the Section menu to delete, rename, and reorder sections.
In release 4.2, you can use either the Edit menu or the Options menu from the Table of Contents panel to perform those tasks.
In release 3.1, you navigate sections by clicking tabs.
In release 4.2, you can enter the section number in the navigational box  and press ENTER, or you can select View ► Section ► section-name as shown in this example:
Saving Reports
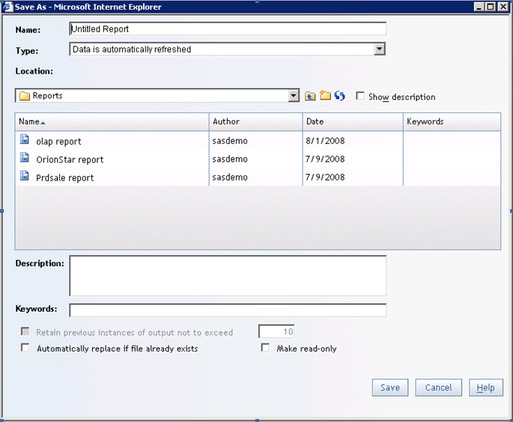
To save a new report, select File ► Save (or Save As), or click the new Save toolbar button  . The Save As dialog box now displays existing reports. You can also save your report in any folder to which you can write.
Resources
Patillo, Sherry, and Styll, Rick. 2008. "What's New in SAS® Web Report Studio 4.2." Proceedings of the SAS Global Forum 2008 Conference. Cary, NC: SAS Institute Inc.
SAS Institute Inc. 2009. "Build Your First Web-based Report Using the SAS® 9.2 Business Intelligence Clients: A practical introduction to SAS® Information Map Studio and SAS® Web Report Studio for new and experienced users". Cary, NC: SAS Institute Inc.
1 In the initial configuration, these tasks (with the exception of changing aggregation settings) are available only to users who are assigned to the Report Creation role in SAS Web Report Studio. The ability to change aggregation settings is available only to users who are in the Advanced role. Roles can be modified. 2 After you access some reports, the Open section of the Getting Started area includes links to the most recently used reports. 3 This paper focuses on tasks that are used to create a report from scratch. You also can create a new report by using the Report Wizard or by starting with a template. 4 In SAS® Information Map Studio 4.2, the information-map creator can choose to hide filters from report creators. The Applied predefined filters box displays only filters that are not hidden. 5 If the data item does not support dynamic value generation, then you must type in the values. 6 In release 3.1, the data item label is used as the name of the prompt. 7 The available menu options depend on which capabilities are assigned to the user's role. 8 As in release 3.1, reports based on multidimensional information maps are synchronized by default.