The VARIOGRAM Procedure

The distance class for a point pair ![]() is determined as follows. The directed line segment
is determined as follows. The directed line segment ![]() is superimposed on the coordinate system that shows the distance or lag classes. These classes are determined by the LAGDISTANCE= option in the COMPUTE statement. Denoting the length of the line segment by
is superimposed on the coordinate system that shows the distance or lag classes. These classes are determined by the LAGDISTANCE= option in the COMPUTE statement. Denoting the length of the line segment by ![]() and the LAGDISTANCE= value by
and the LAGDISTANCE= value by ![]() , the lag class L is determined by
, the lag class L is determined by
where ![]() denotes the largest integer
denotes the largest integer ![]() .
.
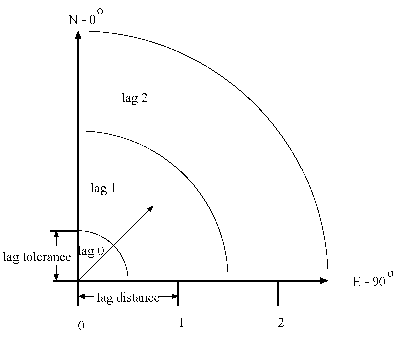
When the directed line segment ![]() is superimposed on the coordinate system that shows the distance classes, it is seen to fall in the first lag class; see
Figure 102.21 for an illustration for
is superimposed on the coordinate system that shows the distance classes, it is seen to fall in the first lag class; see
Figure 102.21 for an illustration for ![]() .
.
Pairwise distances are positive. Therefore, the line segment ![]() might belong to one of the MAXLAG lag classes or it could be shorter than half the length of the LAGDISTANCE= value. In the last case the segment is said to belong to the lag class zero. Hence, lag class zero is smaller than lag classes
might belong to one of the MAXLAG lag classes or it could be shorter than half the length of the LAGDISTANCE= value. In the last case the segment is said to belong to the lag class zero. Hence, lag class zero is smaller than lag classes
![]() MAXLAGS. The definition of lag classes in this manner means that when you specify the MAXLAGS= parameter, PROC VARIOGRAM produces a semivariogram with a total of MAXLAGS+1 lag classes including the zero lag class. For
example, if you specify LAGDISTANCE=1 and MAXLAGS=10 and you do not specify a LAGTOLERANCE= value in the COMPUTE statement in PROC VARIOGRAM, the 11 lag classes generated by the preceding equation are
MAXLAGS. The definition of lag classes in this manner means that when you specify the MAXLAGS= parameter, PROC VARIOGRAM produces a semivariogram with a total of MAXLAGS+1 lag classes including the zero lag class. For
example, if you specify LAGDISTANCE=1 and MAXLAGS=10 and you do not specify a LAGTOLERANCE= value in the COMPUTE statement in PROC VARIOGRAM, the 11 lag classes generated by the preceding equation are
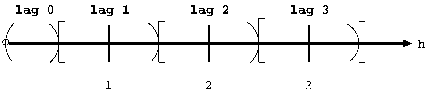
The preceding lag classes description is correct under the assumption of the default lag tolerance, which is half the LAGDISTANCE= value. Using the default lag tolerance results in no gaps between the distance class intervals, as shown in Figure 102.22.
On the other hand, if you do specify a distance tolerance with the LAGTOLERANCE= option in the COMPUTE statement, a further check is performed to see whether the point pair falls within this tolerance of the nearest lag. In the preceding example, if you specify LAGDISTANCE=1 and MAXLAGS=10 (as before) and also specify LAGTOLERANCE=0.25, the intervals become
You might want to avoid this specification because it results in gaps in the lag classes. For example, if a point pair ![]() falls in an interval such as
falls in an interval such as
then it is excluded from the semivariance calculation. The maximum LAGTOLERANCE= value allowed is half the LAGDISTANCE= value; no overlap of the distance classes is allowed.
See the section Computation of the Distribution Distance Classes for a more extensive discussion of practical aspects in the specification of the LAGDISTANCE= and MAXLAGS= options.