The SEQDESIGN Procedure
-
Overview

- Getting Started
-
Syntax
-
DetailsFixed-Sample Clinical TrialsOne-Sided Fixed-Sample Tests in Clinical TrialsTwo-Sided Fixed-Sample Tests in Clinical TrialsGroup Sequential MethodsStatistical Assumptions for Group Sequential DesignsBoundary ScalesBoundary VariablesType I and Type II ErrorsUnified Family MethodsHaybittle-Peto MethodWhitehead MethodsError Spending MethodsAcceptance (beta) BoundaryBoundary Adjustments for Overlapping Lower and Upper beta BoundariesSpecified and Derived ParametersApplicable Boundary KeysSample Size ComputationApplicable One-Sample Tests and Sample Size ComputationApplicable Two-Sample Tests and Sample Size ComputationApplicable Regression Parameter Tests and Sample Size ComputationAspects of Group Sequential DesignsSummary of Methods in Group Sequential DesignsTable OutputODS Table NamesGraphics OutputODS Graphics
-
ExamplesCreating Fixed-Sample DesignsCreating a One-Sided O’Brien-Fleming DesignCreating Two-Sided Pocock and O’Brien-Fleming DesignsGenerating Graphics Display for Sequential DesignsCreating Designs Using Haybittle-Peto MethodsCreating Designs with Various Stopping CriteriaCreating Whitehead’s Triangular DesignsCreating a One-Sided Error Spending DesignCreating Designs with Various Number of StagesCreating Two-Sided Error Spending Designs with and without Overlapping Lower and Upper beta BoundariesCreating a Two-Sided Asymmetric Error Spending Design with Early Stopping to Reject H0Creating a Two-Sided Asymmetric Error Spending Design with Early Stopping to Reject or Accept H0Creating a Design with a Nonbinding Beta BoundaryComputing Sample Size for Survival Data
- References
A one-sided test is a test of a hypothesis with either a lower alternative (![]() ) or an upper alternative (
) or an upper alternative (![]() ), and a two-sided test is a test with a two-sided alternative (
), and a two-sided test is a test with a two-sided alternative (![]() ). The number of critical values for a test depends on whether the alternative is one-sided or two-sided, and it also depends
on whether the trial is conducted with a fixed-sample design or a group sequential design.
). The number of critical values for a test depends on whether the alternative is one-sided or two-sided, and it also depends
on whether the trial is conducted with a fixed-sample design or a group sequential design.
For a fixed-sample trial, a one-sided test has one critical value and a two-sided test has two critical values. These critical
values are computed with the specified Type I error probability ![]() . In contrast, at each interim stage of a group sequential trial, a one-sided test has up to two critical values and a two-sided
group sequential test has up to four critical values. Thus, there are two or four possible boundaries for a group sequential
design, and each boundary is a set of critical values, one from each stage.
. In contrast, at each interim stage of a group sequential trial, a one-sided test has up to two critical values and a two-sided
group sequential test has up to four critical values. Thus, there are two or four possible boundaries for a group sequential
design, and each boundary is a set of critical values, one from each stage.
Figure 83.3 illustrates the boundaries for a one-sided test with an upper alternative that allows for early stopping to either reject or accept the null hypothesis.
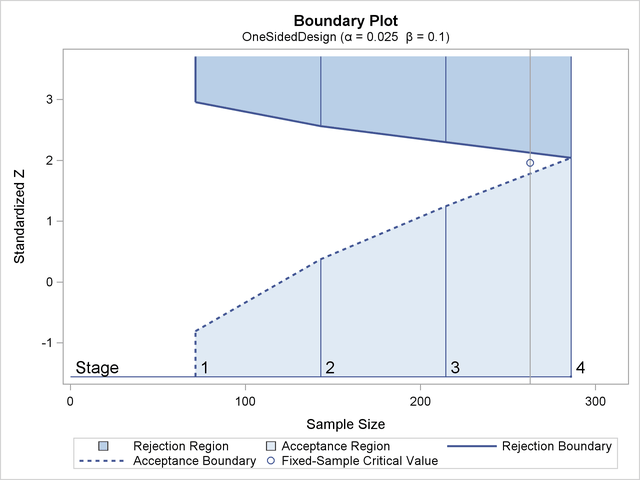
With an upper alternative, as in this example, the design has the following two boundaries: an upper ![]() (rejection) boundary for the rejection region that consists of upper rejection critical values and an upper
(rejection) boundary for the rejection region that consists of upper rejection critical values and an upper ![]() (acceptance) boundary for the acceptance region that consists of upper acceptance critical values. The stages are indicated
by vertical lines with accompanying stage numbers. In Figure 83.3, the horizontal axis indicates the cumulative sample size for the group sequential trial. The vertical axis indicates the
critical values at each stage on the standardized Z scale. Other scales can be used for the vertical axis, including the MLE scale, score statistic scale, and p-value scale.
(acceptance) boundary for the acceptance region that consists of upper acceptance critical values. The stages are indicated
by vertical lines with accompanying stage numbers. In Figure 83.3, the horizontal axis indicates the cumulative sample size for the group sequential trial. The vertical axis indicates the
critical values at each stage on the standardized Z scale. Other scales can be used for the vertical axis, including the MLE scale, score statistic scale, and p-value scale.
At each interim stage, if the test statistic is in the rejection region (darker shaded area in Figure 83.3), the trial stops and the null hypothesis is rejected. If the test statistic is in the acceptance region (lightly shaded
area in Figure 83.3), the trial stops and the hypothesis is accepted. Otherwise, the trial continues to the next stage. If the trial proceeds
to the final stage (stage 4), the upper ![]() and upper
and upper ![]() critical values are identical, and the trial stops to either reject or accept the null hypothesis.
critical values are identical, and the trial stops to either reject or accept the null hypothesis.
If you do not want to stop a trial when a test statistic falls in the acceptance region at an interim stage, you can derive
a design with a nonbinding acceptance boundary to allow the trial to continue while maintaining the Type I error level. You
need to increase the sample size for a design with this nonbinding feature. See the section Acceptance (![]() ) Boundary for a description of the nonbinding acceptance boundary.
) Boundary for a description of the nonbinding acceptance boundary.