The SEQDESIGN Procedure
-
Overview

- Getting Started
-
Syntax
-
DetailsFixed-Sample Clinical TrialsOne-Sided Fixed-Sample Tests in Clinical TrialsTwo-Sided Fixed-Sample Tests in Clinical TrialsGroup Sequential MethodsStatistical Assumptions for Group Sequential DesignsBoundary ScalesBoundary VariablesType I and Type II ErrorsUnified Family MethodsHaybittle-Peto MethodWhitehead MethodsError Spending MethodsAcceptance (beta) BoundaryBoundary Adjustments for Overlapping Lower and Upper beta BoundariesSpecified and Derived ParametersApplicable Boundary KeysSample Size ComputationApplicable One-Sample Tests and Sample Size ComputationApplicable Two-Sample Tests and Sample Size ComputationApplicable Regression Parameter Tests and Sample Size ComputationAspects of Group Sequential DesignsSummary of Methods in Group Sequential DesignsTable OutputODS Table NamesGraphics OutputODS Graphics
-
ExamplesCreating Fixed-Sample DesignsCreating a One-Sided O’Brien-Fleming DesignCreating Two-Sided Pocock and O’Brien-Fleming DesignsGenerating Graphics Display for Sequential DesignsCreating Designs Using Haybittle-Peto MethodsCreating Designs with Various Stopping CriteriaCreating Whitehead’s Triangular DesignsCreating a One-Sided Error Spending DesignCreating Designs with Various Number of StagesCreating Two-Sided Error Spending Designs with and without Overlapping Lower and Upper beta BoundariesCreating a Two-Sided Asymmetric Error Spending Design with Early Stopping to Reject H0Creating a Two-Sided Asymmetric Error Spending Design with Early Stopping to Reject or Accept H0Creating a Design with a Nonbinding Beta BoundaryComputing Sample Size for Survival Data
- References
The purpose of the SEQDESIGN procedure is to design interim analyses for clinical trials. Clinical trials are experiments on human subjects to demonstrate the efficacy and safety of new drugs or treatments. A simple example is a trial to test the effectiveness of a new drug in humans by comparing the outcomes in a group of patients who receive the new drug with the outcomes in a comparable group of patients who receive a placebo.
A clinical trial is conducted according to a plan called a protocol. A protocol details the objectives of the trial, the data collection process, and the analysis. The protocol specifies the
null hypothesis and an alternative hypothesis, a test statistic, the probability ![]() of a Type I error, the probability
of a Type I error, the probability ![]() of a Type II error, the sample size needed to attain a specified power of
of a Type II error, the sample size needed to attain a specified power of ![]() at an alternative reference, and critical values that are associated with the test statistic.
at an alternative reference, and critical values that are associated with the test statistic.
In a fixed-sample trial, data about all individuals are first collected and then examined at the end of the study. Most major trials have committees that periodically monitor safety and efficacy data during the trial and recommend that a trial be stopped for safety concerns such as an unacceptable toxicity level. In certain situations, the committee might recommend that a trial be stopped for efficacy. In contrast to a fixed-sample trial, a group sequential trial provides for interim analyses before the completion of the trial while maintaining the specified overall Type I and Type II error probabilities.
A group sequential trial is most useful in situations where it is important to monitor the trial to prevent unnecessary exposure of patients to an unsafe new drug, or alternatively to a placebo treatment if the new drug shows significant improvement. In most cases, if a group sequential trial stops early for safety concerns, fewer patients are exposed to the new treatment than in the fixed-sample trial. If a trial stops early for efficacy reasons, the new treatment is available sooner than it would be in a fixed-sample trial. Early stopping can also save time and resources.
A group sequential design provides detailed specifications for a group sequential trial. In addition to the usual specification for a fixed-sample design, it provides the total number of stages (the number of interim stages plus a final stage) and a stopping criterion to reject, to accept, or to either reject or accept the null hypothesis at each interim stage. It also provides critical values and the sample size at each stage for the trial.
At each interim stage, the data collected at the current stage in addition to the data collected at previous stages are analyzed,
and statistics such as a maximum likelihood test statistic and its associated standard error are computed. The test statistic
is then compared with critical values that are generated from the sequential design, and the trial is stopped or continued.
If a trial continues to the final stage, the null hypothesis is either rejected or accepted. The critical values for each
stage are chosen in such a way that the overall ![]() and
and ![]() are maintained at the specified levels.
are maintained at the specified levels.
Figure 83.1 shows a two-sided symmetric group sequential trial that stops early to reject the null hypothesis that the parameter Trt is zero.
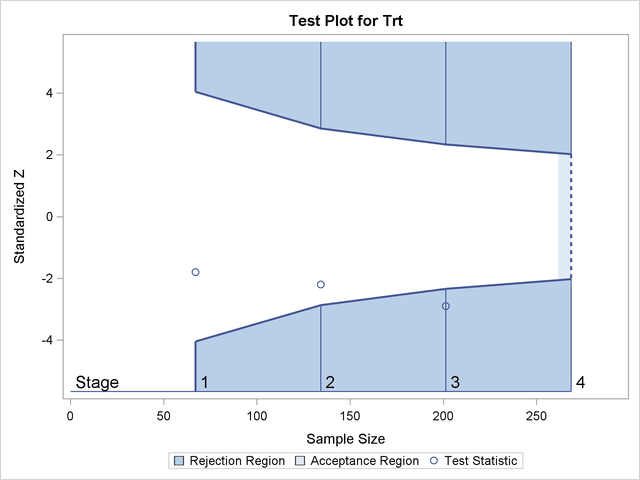
The trial has four stages, which are indicated by the vertical lines labeled 1, 2, 3, and 4. With early stopping to reject the null hypothesis, the lower rejection boundary is constructed by connecting the lower critical values for the stages. Similarly, the upper rejection boundary is constructed by connecting the upper critical values for the stages. The horizontal axis indicates the sample size for the group sequential trial, and the vertical axis indicates the values of the test statistic on the standardized Z scale.
At each interim stage, if the test statistic falls into a rejection region (the darker shaded areas in Figure 83.1), the trial stops and the null hypothesis is rejected. Otherwise, the trial continues to the next stage. At the final stage (stage 4), the null hypothesis is rejected if Z falls into a rejection region. Otherwise, the null hypothesis is not rejected. In Figure 83.1, the test statistic does not fall into the rejection regions for stages 1 and 2, and so the trial continues to stage 3. At stage 3, the test statistic falls into the rejection region, and the null hypothesis is rejected.
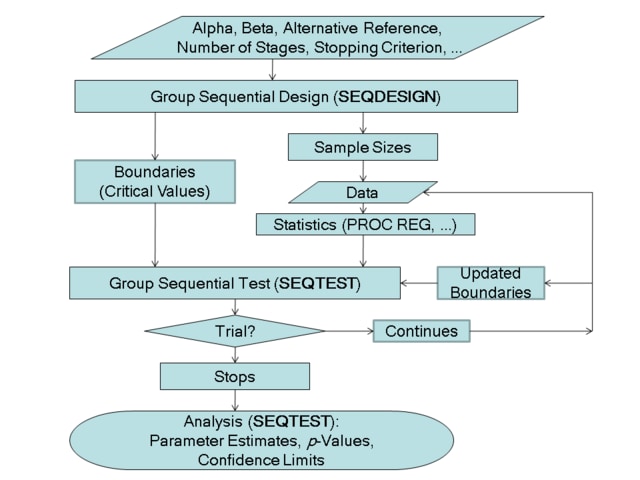
A group sequential trial usually involves six steps:
-
You specify the statistical details of the design, including the null and alternative hypotheses, a test statistic for the hypothesis test, the Type I and II error probabilities, a stopping criterion, the total number of stages, and the relative information level at each stage.
-
You compute the boundary values for the trial based on the specifications in Step 1. You also compute the sample size required at each stage for the specified hypothesis test.
-
At each stage, you collect additional data with the required sample sizes. The data available at each stage include the data collected at previous stages in addition to the data collected at the current stage.
-
At each stage, you analyze the available data with a procedure such as the REG procedure, and you compute the test statistic.
-
At each stage, you compare the test statistic with the corresponding boundary values. You stop the trial to reject or accept the hypothesis, or you continue the trial to the next stage. If you continue the trial to the final stage, you either accept or reject the hypothesis.
-
After the trial stops, you compute parameter estimates, confidence limits for the parameter, and a p-value for the hypothesis test.
You use the SEQDESIGN procedure at Step 2 to compute the initial boundary values and required sample sizes for the trial. You use the companion SEQTEST procedure at Step 5 to compare the test statistic with its boundary values. At stage 1, the boundary values are derived by using the boundary information tables created by the SEQDESIGN procedure. These boundary information tables are structured for input to the SEQTEST procedure. At each subsequent stage, the boundary values are derived by using the test information tables are created by the SEQTEST procedure at the previous stage. These test information tables are also structured for input to the SEQTEST procedure. You also use the SEQTEST procedure at Step 6 to compute parameter estimates, confidence limits, and p-values after the trial stops.
The flowchart in Figure 83.2 summarizes the steps in a typical group sequential trial and the relevant SAS procedures.