The TTEST Procedure

Example 95.5 Equivalence Testing with Lognormal Data
Wellek (2003, p. 212) discusses an average bioequivalence study comparing the AUC (area under serum-concentration curve) measurements for two different drugs, denoted "Test" and "Reference," over a period of 20 hours. This example looks at a portion of Wellek’s data, conducting an equivalence analysis with a paired design that uses AUC values on the original scale (assumed to be lognormally distributed). Each subject in the study received the Test drug upon one visit and then the Reference drug upon a later visit, sufficiently spaced so that no carryover effects would occur.
The goal is to test whether the geometric mean AUC ratio between Test and Reference is between 0.8 and 1.25, corresponding to the traditional FDA (80%, 125%) equivalence criterion. See the section Arithmetic and Geometric Means for a discussion of the use of geometric means for lognormal data.
The following SAS statements generate the data set:
data auc;
input TestAUC RefAUC @@;
datalines;
103.4 90.11  59.92 77.71  68.17 77.71  94.54 97.51
69.48 58.21  72.17 101.3  74.37 79.84  84.44 96.06
96.74 89.30  94.26 97.22  48.52 61.62  95.68 85.80
;
run;
You can display the data by using the following statements, which produce Output 95.5.1:
proc print data=auc;
run;
| Obs | TestAUC | RefAUC |
|---|---|---|
| 1 | 103.40 | 90.11 |
| 2 | 59.92 | 77.71 |
| 3 | 68.17 | 77.71 |
| 4 | 94.54 | 97.51 |
| 5 | 69.48 | 58.21 |
| 6 | 72.17 | 101.30 |
| 7 | 74.37 | 79.84 |
| 8 | 84.44 | 96.06 |
| 9 | 96.74 | 89.30 |
| 10 | 94.26 | 97.22 |
| 11 | 48.52 | 61.62 |
| 12 | 95.68 | 85.80 |
The TestAUC and RefAUC variables represent the AUC measurements for each subject under the Test and Reference drugs, respectively. Use the following SAS statements to perform the equivalence analysis:
ods graphics on;

proc ttest data=auc dist=lognormal tost(0.8, 1.25);
   paired TestAUC*RefAUC;
run;

ods graphics off;
The DIST=LOGNORMAL option specifies the lognormal distributional assumption and requests an analysis in terms of geometric mean and coefficient of variation. The TOST option specifies the equivalence bounds 0.8 and 1.25.
Output 95.5.2 shows basic summary statistics for the ratio of TestAUC to RefAUC.
| N | Geometric Mean | Coefficient of Variation |
Minimum | Maximum |
|---|---|---|---|---|
| 12 | 0.9412 | 0.1676 | 0.7124 | 1.1936 |
The geometric mean ratio of 0.9412 is the sample mean of the log-transformed data exponentiated to bring it back to the original scale. So the plasma concentration over the 20-hour period is slightly lower for the Test drug than for the Reference drug. The CV of 0.1676 is the ratio of the standard deviation to the (arithmetic) mean.
Output 95.5.3 shows the  confidence limits for the geometric mean ratio (0.8467 and 1.0462) and CV (0.1183 and 0.2884).
| Geometric Mean | 95% CL Mean | Coefficient of Variation |
95% CL CV | ||
|---|---|---|---|---|---|
| 0.9412 | 0.8467 | 1.0462 | 0.1676 | 0.1183 | 0.2884 |
Output 95.5.4 shows the  confidence limits for the geometric mean ratio, 0.8634 and 1.0260.
| Geometric Mean | Lower Bound | 90% CL Mean | Upper Bound | Assessment | |||
|---|---|---|---|---|---|---|---|
| 0.9412 | 0.8 | < | 0.8634 | 1.0260 | < | 1.25 | Equivalent |
The assessment of "Equivalent" reflects the fact that these limits are contained within the equivalence bounds 0.8 and 1.25. This result occurs if and only if the  -value of the test is less than the
  value specified in the ALPHA= option in the PROC TTEST statement, and it is the reason that
  confidence limits are shown in addition to the usual
  limits.
Output 95.5.5 shows the -values for the two one-sided tests against the upper and lower equivalence bounds.
| Test | Null | DF | t Value | P-Value |
|---|---|---|---|---|
| Upper | 0.8 | 11 | 3.38 | 0.0031 |
| Lower | 1.25 | 11 | -5.90 | <.0001 |
| Overall | 0.0031 |
The overall -value of 0.0031, the larger of the two one-sided -values, indicates significant evidence of equivalence between the Test and Reference drugs.
The summary panel in Output 95.5.6 shows a histogram, kernel density, box plot, and confidence interval of the Test-to-Reference ratio of AUC, along with the equivalence bounds.
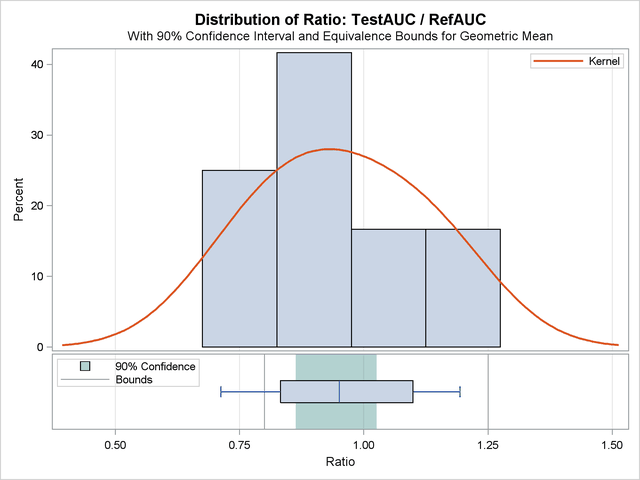
The confidence interval is closer to the lower equivalence bound than the upper bound and contained entirely within the bounds.
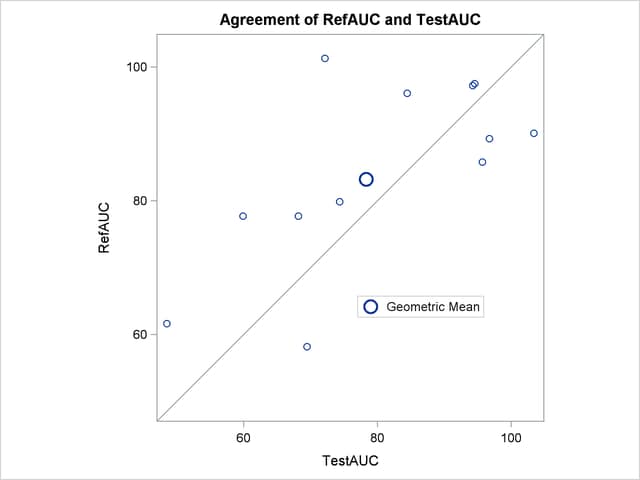
The agreement plot in Output 95.5.7 reveals that the only four subjects with higher AUC for the Test drug are at the far lower or far upper end of the AUC distribution. This might merit further investigation.
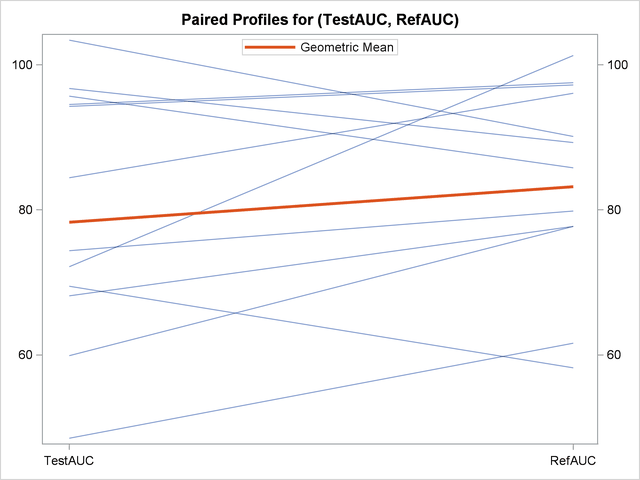
The profiles plot in Output 95.5.8 is a different view of the same information contained in Output 95.5.7, plotting the AUC from Test to Reference drug.