The SEQDESIGN Procedure
-
Overview

- Getting Started
-
Syntax
-
Details
Fixed-Sample Clinical Trials One-Sided Fixed-Sample Tests in Clinical Trials Two-Sided Fixed-Sample Tests in Clinical Trials Group Sequential Methods Statistical Assumptions for Group Sequential Designs Boundary Scales Boundary Variables Type I and Type II Errors Unified Family Methods Haybittle-Peto Method Whitehead Methods Error Spending Methods Acceptance (beta) Boundary Boundary Adjustments for Overlapping Lower and Upper beta Boundaries Specified and Derived Parameters Applicable Boundary Keys Sample Size Computation Applicable One-Sample Tests and Sample Size Computation Applicable Two-Sample Tests and Sample Size Computation Applicable Regression Parameter Tests and Sample Size Computation Aspects of Group Sequential Designs Summary of Methods in Group Sequential Designs Table Output ODS Table Names Graphics Output ODS Graphics Acknowledgments
-
Examples
Creating Fixed-Sample Designs Creating a One-Sided O’Brien-Fleming Design Creating Two-Sided Pocock and O’Brien-Fleming Designs Generating Graphics Display for Sequential Designs Creating Designs Using Haybittle-Peto Methods Creating Designs with Various Stopping Criteria Creating Whitehead’s Triangular Designs Creating a One-Sided Error Spending Design Creating Designs with Various Number of Stages Creating Two-Sided Error Spending Designs with and without Overlapping Lower and Upper beta Boundaries Creating a Two-Sided Asymmetric Error Spending Design with Early Stopping to Reject H0 Creating a Two-Sided Asymmetric Error Spending Design with Early Stopping to Reject or Accept H0
- References
| Acceptance (beta) Boundary |
In a group sequential trial, the rejection boundary is derived under the null hypothesis  and is used to stop the trial early to reject . Similarly, the acceptance boundary is derived under the alternative hypothesis and is used to stop the trial early to accept . But, for a trial with early stopping either to reject or to accept the null hypothesis, dependency exists between these two boundaries. This section describes the effects of the acceptance boundary on the derivation of the rejection boundary in a group sequential trial.
The following statements create a one-sided four-stage group sequential design with early stopping either to reject or to accept :
ods graphics on;
proc seqdesign altref=10;
   ErrSpendPower_2: design nstages=4
                    method=errfuncpow(rho=2)
                    alt=upper   stop=both
                    alpha=0.025 beta=0.10;
run;
ods graphics off;
The ALTREF=10 option specifies the alternative reference  . The METHOD=ERRFUNCPOW(RHO=2) option uses a
  power family error spending method to generate the rejection boundary. The ALPHA=0.025 and BETA=0.10 options specify the Type I error level
  and Type II error level
  , respectively.
The power parameter used in the design lies between  and
and  , where the boundaries created with the power family error spending method are similar to the boundaries created from the Pocock method, and the boundaries created with are similar to the boundaries created from the O’Brien-Fleming method.
The "Boundary Information" table in Figure 80.12 shows the rejection and acceptance boundary values at the stages. With an error spending function method, the boundary values are derived sequentially. In particular, the rejection boundary value at a stage is derived conditionally on both rejection and acceptance boundary values at the previous stage. See the section Error Spending Methods for a detailed description of the error spending methods.
| Boundary Information (Standardized Z Scale) Null Reference = 0 |
|||||
|---|---|---|---|---|---|
| _Stage_ | Alternative | Boundary Values | |||
| Information Level | Reference | Upper | |||
| Proportion | Actual | Upper | Beta | Alpha | |
| 1 | 0.2500 | 0.028605 | 1.69130 | -0.80640 | 2.95517 |
| 2 | 0.5000 | 0.05721 | 2.39186 | 0.37356 | 2.55934 |
| 3 | 0.7500 | 0.085815 | 2.92942 | 1.24940 | 2.29904 |
| 4 | 1.0000 | 0.11442 | 3.38261 | 2.04182 | 2.04182 |
With ODS Graphics enabled, the "Boundary Plot" is displayed by default, as shown in Figure 80.13. The continuation region is affected by the acceptance boundary, and the rejection boundary is thus adjusted for this acceptance boundary to maintain the Type I error level.
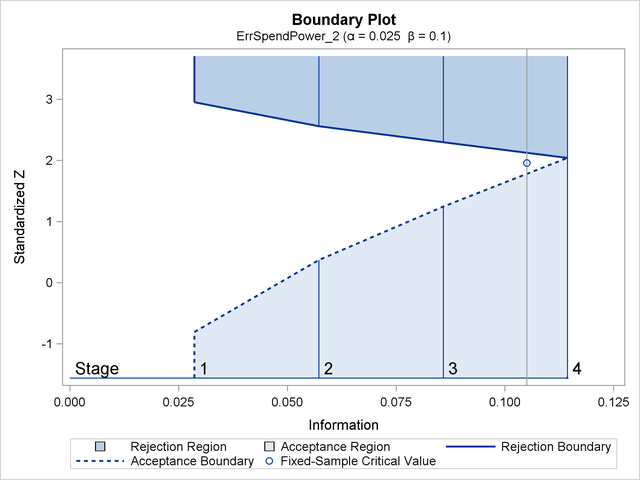
For a design with early stopping either to accept or to reject , the shapes of boundaries affect the critical value at the final stage. For the acceptance boundary, a liberal method at early stages, such as a power family error spending method, lowers the critical value at the final stage. For the rejection boundary, a conservative method at early stages, such as a power family error spending method, also lowers the critical value at the final stage. In addition, a larger Type II error level also lowers the critical value at the final stage. The resulting critical value at the final stage might even be less than the critical value for the corresponding fixed-sample design.
To illustrates how this can occur, the following statements use a power family error spending method for the acceptance boundary and a power family error spending method for the rejection boundary to create a group sequential design:
proc seqdesign altref=10;
   ErrSpendPower_3_1: design nstages=4
                      method(alpha)=errfuncpow(rho=3)
                      method(beta)= errfuncpow(rho=1)
                      alt=upper   stop=both
                      alpha=0.025 beta=0.10;
run;
The resulting "Boundary Information" table in Figure 80.14 shows that the boundary value at the final stage  is less than
  , the critical value of the corresponding fixed-sample design.
| Boundary Information (Standardized Z Scale) Null Reference = 0 |
|||||
|---|---|---|---|---|---|
| _Stage_ | Alternative | Boundary Values | |||
| Information Level | Reference | Upper | |||
| Proportion | Actual | Upper | Beta | Alpha | |
| 1 | 0.2500 | 0.029725 | 1.72410 | -0.23587 | 3.35935 |
| 2 | 0.5000 | 0.05945 | 2.43824 | 0.63117 | 2.76024 |
| 3 | 0.7500 | 0.089175 | 2.98622 | 1.31554 | 2.35119 |
| 4 | 1.0000 | 0.1189 | 3.44819 | 1.92672 | 1.92672 |
That is, can be rejected even if the test statistic at the final stage is less than the critical value for the corresponding fixed-sample design, which is not desirable. Therefore, for a design with an acceptance boundary, the design should be used with care.
Another reason why the rejection boundary should not be affected by the acceptance boundary is that a Data and Safety Monitoring Board (DSMB) might not strictly adhere to this acceptance boundary, and thus the Type I error level might not be maintained. Therefore, it might not be desirable for the rejection boundary to be affected by the acceptance boundary (Lan and DeMets 2009, p. 103).
To avoid this problem, you can create a design with only a rejection boundary, and then provide a strategy for early stopping to accept without affecting the rejection boundary. The available strategies include:
creating a separate design with early stopping only to accept
, and then using this acceptance boundary as a guideline using the conditional power approach
For a group sequential design with early stopping only to reject , the conditional power at an interim stage  is the probability that will be rejected at the final stage under a specified hypothetical reference, given the observed statistic at stage . A small conditional power indicates a small probability of success (rejecting
  ) given the current data, and the trial can be stopped early to accept (Lan, Simon, and Halperin 1982; Lan and DeMets 2009, p. 101). For a detailed description of conditional power, see the section "Stochastic Curtailment" in "The SEQTEST Procedure."